Discussing climate and population can be controversial. There is a long history of racist, classist, xenophobic writing on this topic.
And the sad history of physical scientists making blundering remarks about human beings provides plenty of motivation for amateurs to avoid commenting on anything related to projections of future human migration. Nevertheless, …
Physicists often make very simple quantitative models leaving out many factors to try to get some first-order understanding. For environmental scientists, this framing perhaps reached its apogee with John Harte‘s book, “Consider a Spherical Cow“.
Social scientists (with the exception of some economists!), aware as they usually are of the multiplicity of factors that influence the behavior of people in societies, are often loath to make quantitative models of social change. (In contrast, some economists take the quantitative results of “spherical cow” economics models such as DICE too literally, but that is another discussion.)
In developing the climate damage function for DICE-2016R, Nordhaus used regressions on gridded economic and climate data to estimate the effect of climate change on economic productivity. Noticing that population density was one of the factors in the G-ECON database considered in Nordhaus’s regressions, we thought, “What would happen if we applied Nordhaus’s methodology, but used it to predict changes in population density, rather than changes in GDP?”
We understand that a multiplicity of factors affect migration decisions. People have jobs and friends and families and speak specific languages and engage in idiosyncratic cultural practices. These factors can influence people to remain, even if their local climate deteriorates. Therefore, we make no claims to predict future migration flows, but rather ask the question: “If climate were the only factor operating, how many people would we predict would want to migrate?” This might be some sort of strong upper bound on maximum likely migration flows.
We first regressed population density on a host of geographical factors (e.g., distance to rivers or the ocean) and also on climatic factors (e.g., temperature and precipitation). We then used climate model projections to estimate possible future climate conditions under different scenarios and then asked what was the ratio of the predicted population under the changed climate relative to the predicted population under the current climate. The departure of this ratio from the value of one, we took as an indicator of the fraction of population that would have incentive to migrate from (or immigrate to) a specific location.
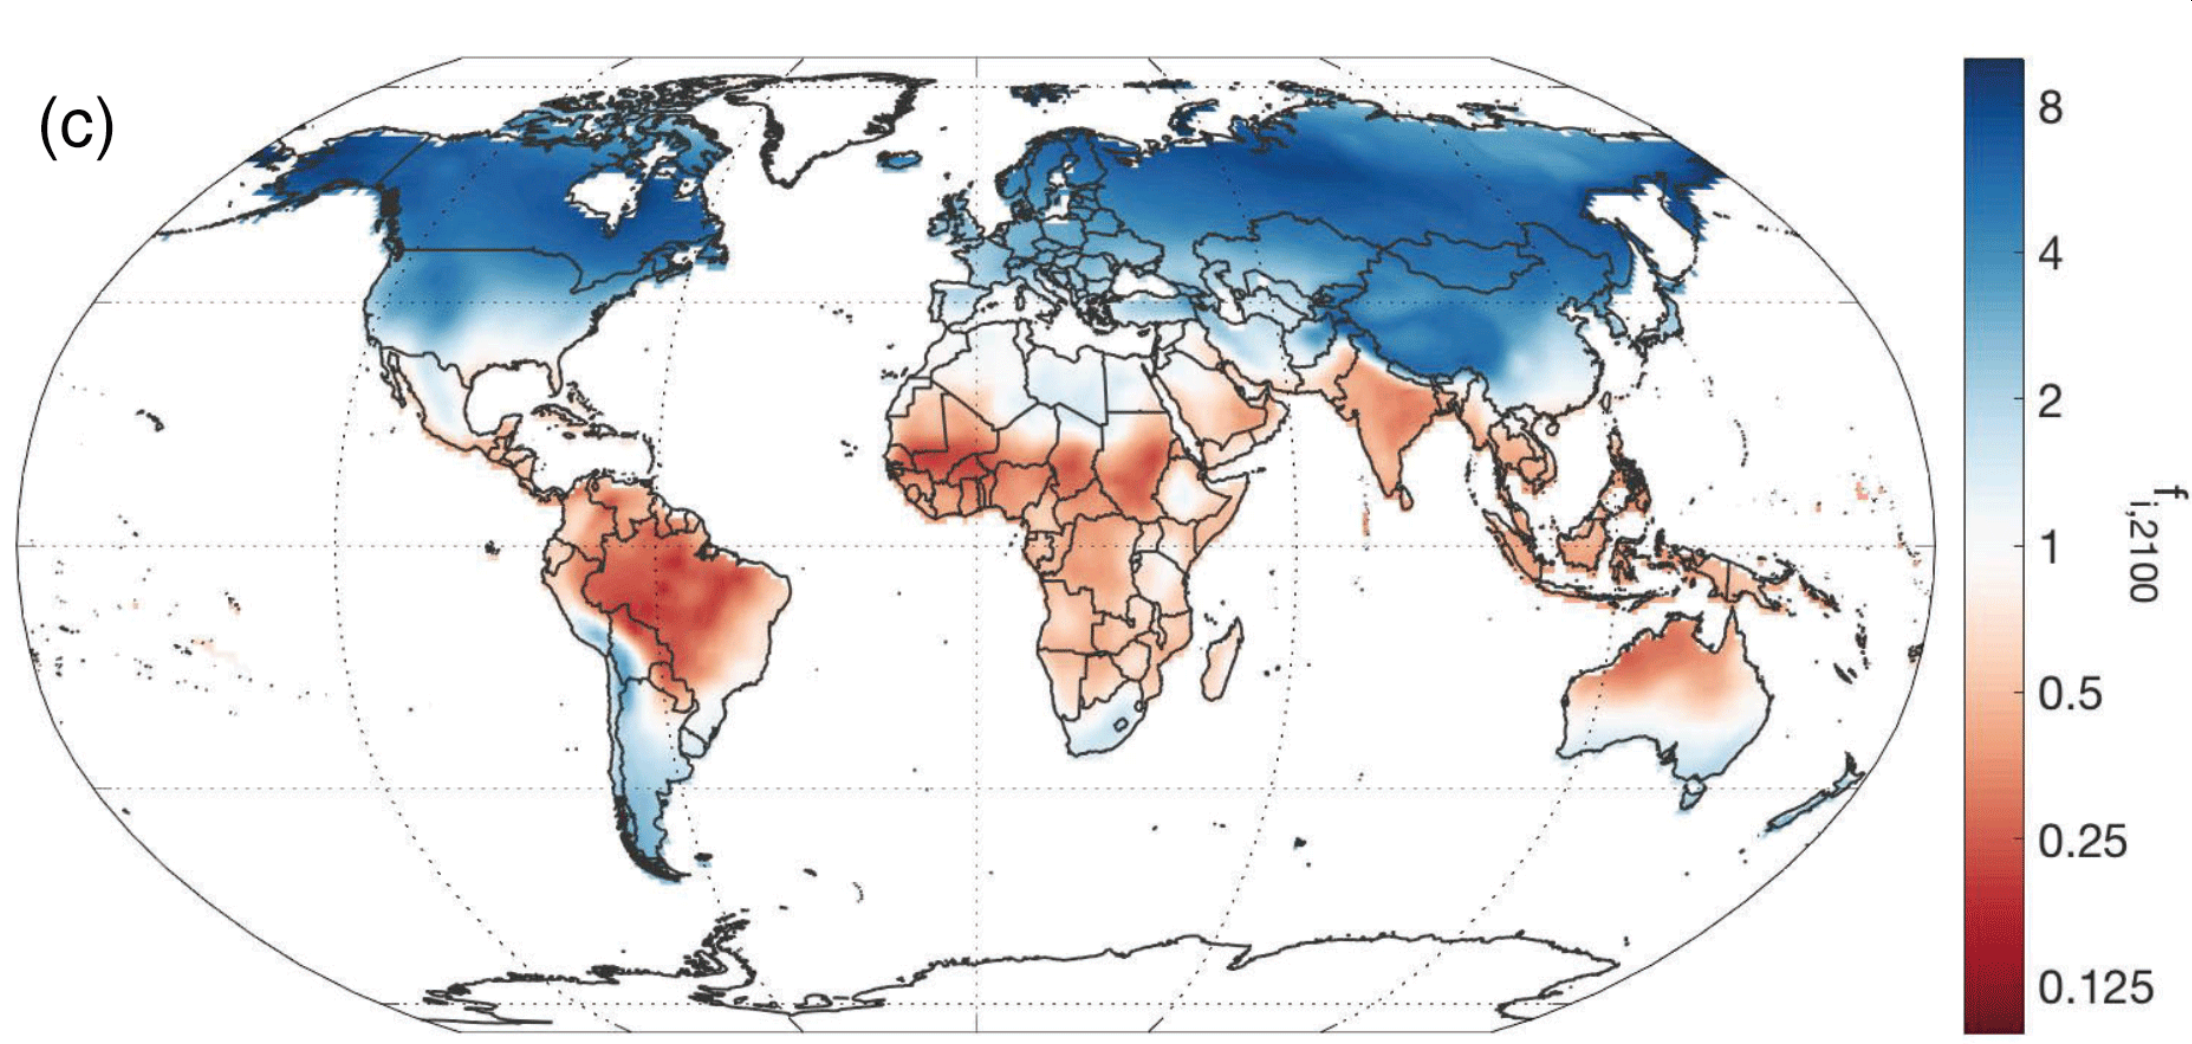
Figure 1. Ratio of population predicted under RCP8.5 end-of-century projections divided by population predicted for current climate. The tropics are anticipated to be a region in which climate change may provide many people with an additional incentive to emigrate. (Chen and Caldeira, 2020)
This exercise predicts (Figure 1) that climate change would provide people living in much of the tropics an incentive to emigrate, and that the mid and higher latitudes, especially in the Northern Hemisphere, would be potential recipient regions for these migrants.
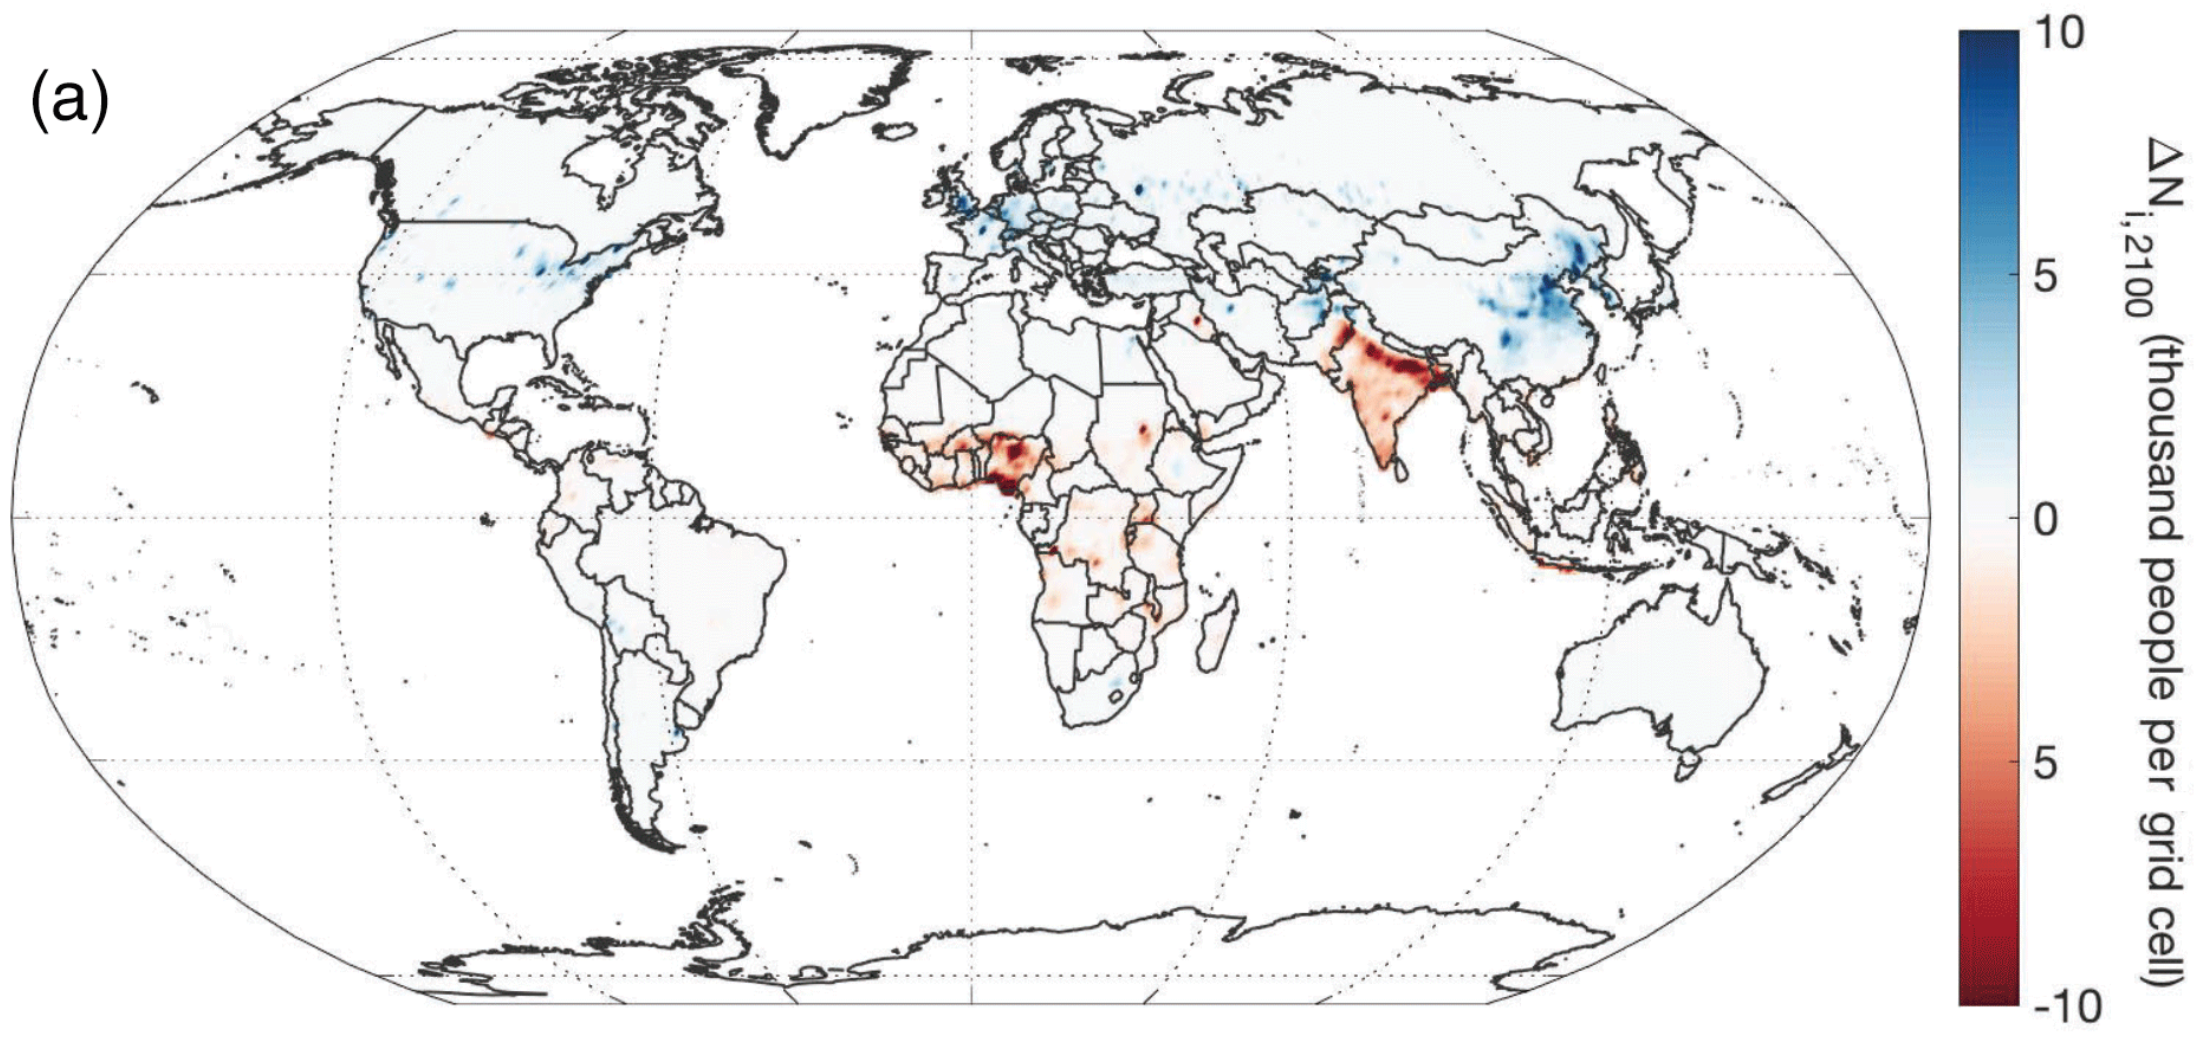
Figure 2. Number of people per grid cell projected to have additional incentive to migrate under RCP8.5 end-of-century projections. This map is the map in Figure 1 multiplied by a map of projected population. (Chen and Caldeira, 2020)
The number of people projected to have additional incentive to migrate (Figure 2) is calculated as the product of the climate-related factors shown in Figure 1 and a UN population projection.
Figure 1 shows that the Amazon might be place from which climate change would add incentive to emigrate, but relatively few people live in the Amazon, so the Amazon does not show up in Figure 2 as a region with many people with additional incentive to emigrate.
In contrast, India has a hot climate that is getting hotter, along with very high population densities, and so stands out as a place from which many people may potentially be incentivized to emigrate, showing up as red on both Figures 1 and 2.
Many people think that the RCP8.5 scenario featured in the figures above are unrealistic. (We include figures for other RCP scenarios in the Supporting Material.)
Figure 3. Scaling of number of people having incentive to migrate as a function of increase in global mean temperature relative to year 2005. (Chen and Caldeira, 2020)
Our results for number of people with additional incentive to migrate as a function of increase in global mean temperature relative to year 2005 across the range of RCP scenarios and time periods between now and the end of the century scale fairly linearly with global mean temperature change (Figure 3).
By year 2005, the world had warmed nearly 1 C relative to pre-industrial temperatures, and by now it has warmed more than 1 C. Our analysis suggests that warming to, say, 2 C above preindustrial values could provide more than 500 million people additional incentive to emigrate. Warmings of 3 C or more above preindustrial values could provide additional incentive-to-emigrate to well over a billion people.
Our “all other things equal” spherical-cow-type calculation indicates the large magnitudes of people for whom climate change may provide additional incentive to migrate (although they may have overwhelming incentives to remain where they are) . Therefore, only a small fraction of people with additional incentive to migrate might actually migrate.
I’d like to point out that many cities (Dubai, Houston, Las Vegas, etc) exist because the people there are relatively rich and can afford air conditioning.
And few people have starved to death with money in their pockets.
Rich people have greater capacity to migrate, but poor people tend to be more directly affected by weather and climate.
It is not the purpose of our study to try to predict real migration flows, but rather to do some simple analyses to indicate the possible scale of the issue.
Our analysis indicates that the potential scale is very large. Substantial effort will be required to produce an energy system that does not use the sky as a dumping ground for waste CO2, and thereby limit the amount of climate change. Further, substantial effort will be required to help develop economies that can deliver to people the things they need to live the most rewarding lives they can have.
The purpose of our paper is not to predict how many climate migrants there may be in the future, but rather to emphasize how important it is that we address climate and development issues in an integrated way, so that we protect our environment and create a world in which every child has the opportunity of living a rewarding and fulfilling life.
The following is based on a note written to a journalist asking for my opinion on funding for fusion research. Obviously, these are just my opinions …
History has shown us that experts are very bad at predicting technological winners and losers.
There are only a very small number of technologies that could potentially provide energy at the scale that civilization requires without severely damaging the environment, and fusion power is a member of that elite club. Therefore, some resources should be allocated to trying to make fusion power safe, abundant, and affordable.
While I am no expert on the matter, it seems to me that even if fusion could be made to work, it might turn out to be costly.
In any case, the question should be: What fraction of the clean energy research and development budget should be allocated to fusion?
My sense is that 1% would be too small, and 100% would be too large, and so it maybe something to which it might be worth allocating 5 or 10% of the clean energy research and development budget.
And of course, it is not just about shares of the R&D pie. The clean energy R&D pie itself needs to be much larger than it is today.
We need to adopt a portfolio approach, with some investments yielding fruit over the next years and decades, and with other investments perhaps yielding fruit only later this century.
It is never too early or too late to develop improved sources of safe, abundant, and affordable energy. Sooner is better than later, but later is better than never.
We should avoid believing that we know with a high degree of confidence what will work and what will never work. We should have humility in our own judgments and think that we might be wrong — that this technology which we believe will never substantively contribute to solving societal problems might just turn out to be the thing upon which we all depend.
Therefore, we need to be thinking about broad research portfolios, while carefully evaluating each item in that portfolio in terms of potential benefits of research investment, balancing risks against rewards.
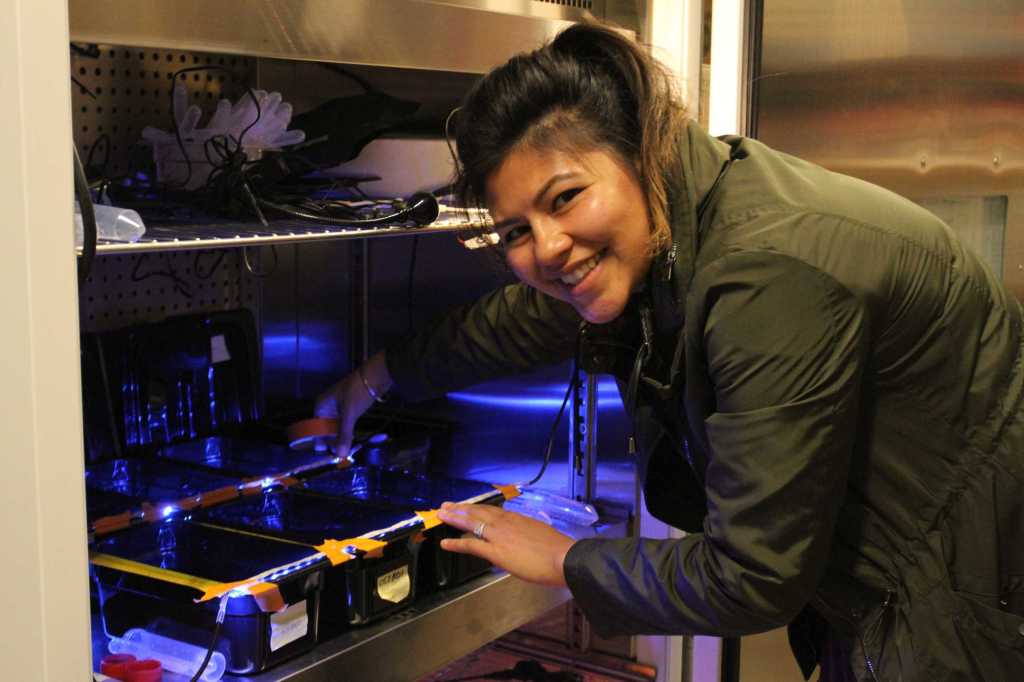
Shawna Foo investigating the role of light and algal symbionts in the movement of sea anemone. (Photo: Ken Caldeira)
Sea anemones are animals that are very much like corals, except they don’t make stony skeletons and they can move. They are also similar to coral polyps because they host algae, which produce food for the host when the algae are exposed to light.
Shawna Foo, a postdoc at Carnegie Institution for Science’s Dept of Global Ecology when she did this work, investigated movement of sea anemones and how it was affected by the presence of algal symbionts — and what she found was quite amazing !!
When sea anemones host algae, the algae enters the cells of the anemone. The anemone provides the algae with nutrients, and after capturing energy from sunlight, the algae provides the anemone with food. Sea anemone can survive without the food they get from there algal guests. They can wave their arms around and capture food that might be suspended in their vicinity.
Shawna found that when the sea anemones hosted algae, the sea anemones moved towards the light, but when they did not host algae they did not move towards the light.
I normally eschew anthropomorphic thinking, but in this case I want to have a little fun. We can assume that there are mechanistic pathways that explain this finding, but these observations lend themselves to thinking about explanations in terms of intentions, control, and goals.
Perhaps it is the algae that is sensing the light, and then the algae takes control of the anemone and commands the animal to move towards the light, so that it can photosynthesize more rapidly. If this is the case, it is really surprising that a plant-like photosynthetic algae can control an animal.
On the other hand, perhaps it is the anemone that is sensing the light, and the anemone is controlling the algae and moving it towards the light so that the animal can get more food.
In either case, evolution created a symbiotic pairing that moves towards the light so that both the anemone and its algal symbiont can prosper.
Mechanisms still need to be worked out, and anthropomorphic language is rarely justified in science, but nevertheless it is possible that a photosynthetic plant-like algae is controlling the motion of an animal and causing the animal to move towards the light. Seems amazing to me.
This work was published in the journal Coral Reefs, and is available under open access.
Foo, S.A., Liddell, L., Grossman, A. et al. Coral Reefs (2019). Photo-movement in the sea anemone Aiptasia influenced by light quality and symbiotic association. https://doi.org/10.1007/s00338-019-01866-w
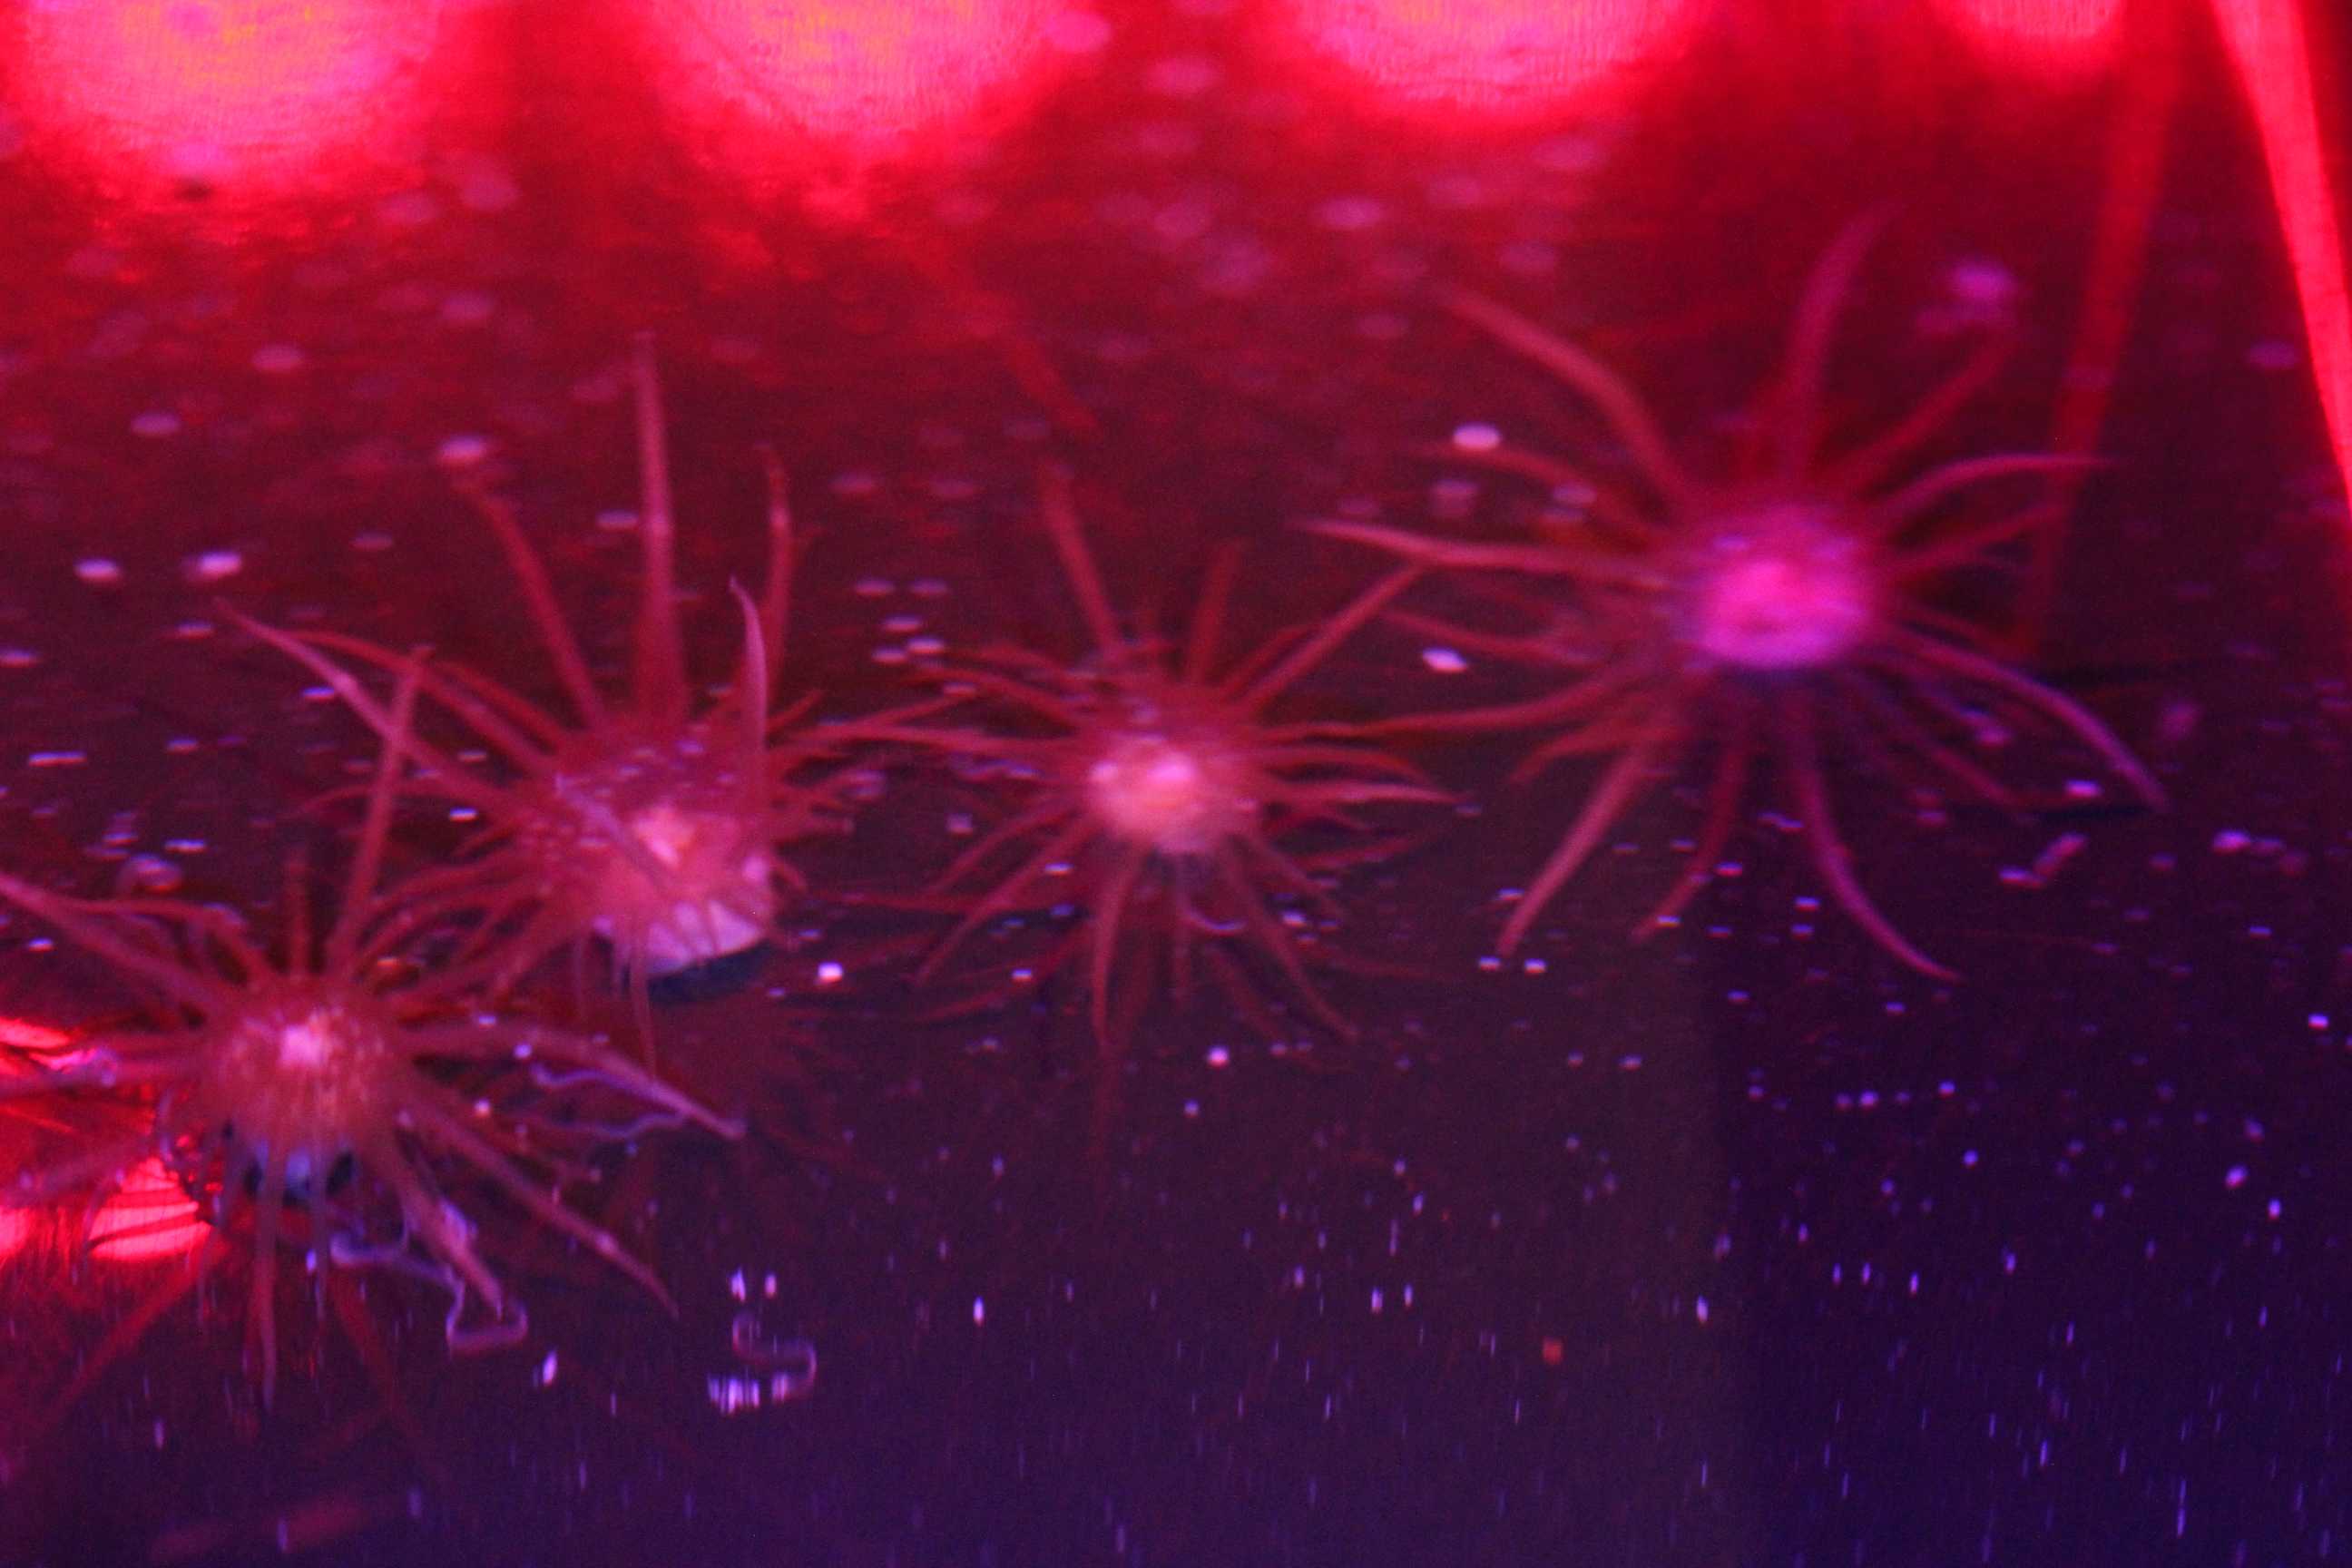
Some of the little sea anemones used in our experiments, under red light. (Photo: Ken Caldeira)
(Apparently, “I’m so sorry for your loss” and “Thank you” are the culturally appropriate responses.)
She died of cancer. Through most of her decline she had hopes of getting better, and these hopes sustained her. As she was declining, she didn’t have the focus needed to read, and therefore spent a lot of time watching Judge Mathis on TV.
But a few weeks before she died, she did get a bit better, and was well enough to read about von Humboldt’s adventures in South America. She was rhapsodic about the thoughtfulness and artistry that went into producing this book. This book was able to transport an elderly woman in bed with cancer in Pennsylvania to von Humboldt’s side on the banks of the Orinoco.
I arrived at my mom’s house about a week before she died, to be with her and help my sister who had been her principal care-giver.
When I arrived, I hugged her and she said “I greatly appreciate your being here,” adding, “I feel so lucky”.
It is remarkable that, lying there with terminal cancer less than a week before her death, my mom could feel lucky because there was family around whom she loved and who loved her. She was able to focus on the positive, despite the overwhelmingly negative aspect of the overall situation.
A year or two ago, a friend died. He was in his early seventies, in contrast to my mom’s eighty-eight.
When things got grim, he got bitter, angry and depressed. A very understandable response. Life was painful, unfair and unjust. Everything was boring. Nothing was good enough.
My bitter, depressed and despondent friend made the end of his life a misery for himself and everyone around him.
My mom’s ability to focus on the positive made the end of her life as good as it could be, and her positive outlook made it a pleasure for my sister and me to care for her through her last days.
A certain amount of how we respond to events emotionally is hard-wired into our genetic make-up or ingrained into us during our childhoods.
But we do have agency. We can to some extent train ourselves to be more positive in our emotional responses to situations. We can train ourselves to continually ask: What is good here? What is going right? What is there to appreciate in this?
[I am reminded of going to the Legion of Honor museum in San Francisco with the Russian Painter Andrei Lyssenko. At each painting he would stop and point out something the painter did well — it might be a single paint-stroke outlining the edge of a jacket or a small patch color in the background. Going to an art museum is a different experience if you are asking yourself what you can find to appreciate in each painting.]
We are hunter-gatherers, with brains that evolved as problem-solving machines — so we have a natural tendency to focus on our problems. This is fine if the problem is soluble, but obsessing about problems for which there is no solution helps nobody.
And focusing on problems has us focusing on the negative — and not on appreciating what is going well in our lives. How many unnecessary divorces have happened because people didn’t remind each other (and themselves) about what they appreciate in the other person?
If presented with glass half-full, we can train ourselves to see the glass half full. When we see it as half empty, we can stop ourselves, and remind ourselves that it is also half full.
We need to see the negative to help solve the problems that we can solve, but we need also to remain aware of the positive so that we can appreciate what is going right with the world, and with our human relationships, and with our lives.
The main person who will suffer from our bitterness and negativity is ourselves. A world in which everyone is focused on what is going wrong is an unpleasant world in which to live.
Both to improve our lives and to improve the lives of people around us, we need to work on focusing on what is going right with our lives and with the world. We need to learn to see the glass as half full.
Matt Rozsa of Salon.com asked me to comment on ‘addiction as a metaphor for our ecologically unsustainable consumption patterns’ for a story he was writing. Unfortunately, I was too late for his story, so I publish here a lightly edited version of the largely substance-free content I sent to him.
We all have emotional voids that we are trying to fill with consumer products.
We are all constantly bombarded with advertising, much of it telling us that if we want to be held in high regard by others, we need to buy some fancy car or expensive trinkets — if we want to be loved by others, we need to buy more and more costly consumer products.
If we were all constantly bombarded by advertising telling us that we could fill emotional voids and achieve social status by consuming heroin, we would all be heroin addicts by now.
Imagine how many heroin addicts there would be if as we walked down the street, there would be shop after shop with alluring displays of heroin in various forms, advertising 50% off this week only.
The promotion of consumerism is as dangerous at a global level as the promotion of heroin is at an individual level.
It is one thing to be in poverty, and meeting real needs with increased consumption (shelter, food, clothing, etc).
It is another thing entirely to be living a life of affluence, attempting to get another shot of dopamine through impulse buying.
We are embedded in a world in which we are encouraged at every turn to sink ever deeper into our addiction to consumer products in a futile attempt to fill our emotional emptiness.
But consumer products do improve my life. Some consumer products do bring me real joy. For example, I love my bass guitar and my motorcycle.
But when I look at all the junk in my closets and garage, I see wasteful and unsuccessful efforts to solve problems with consumer products that consumer products cannot solve.
We need to find some way of consuming only that which will bring us real joy, and look within ourselves, and to family, friends and lovers, to fill our emotional voids.
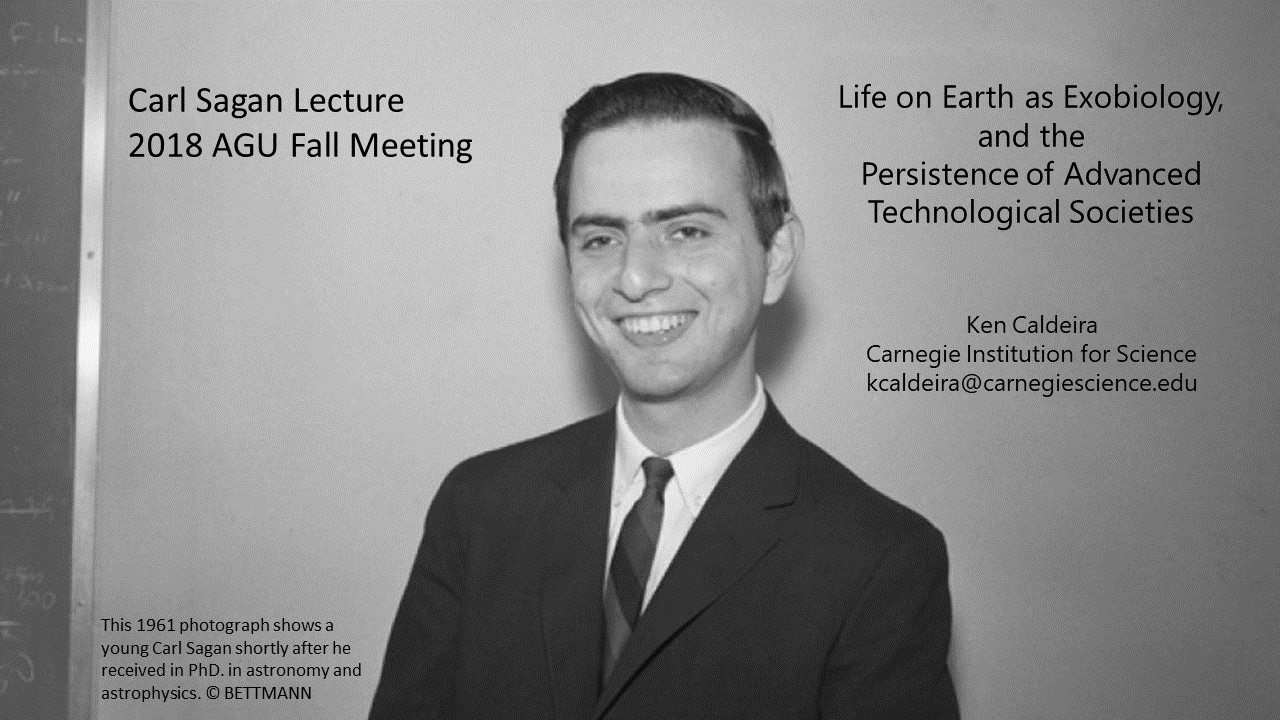
This is an edited transcript from my Carl Sagan Lecture on 10 Dec 2018 at the American Geophysical Union 2018 Fall Meeting. The transcript has been edited, so in some places represents what I meant to say, rather than what I did say.
Introduction by Ariel Anbar:
I’m Ariel Anbar. I’m the president of the Biogeosciences Section of AGU which has the honor of organizing the Sagan Lecture this year. The same lecture is shared between the Biogeosciences and Planetary Sciences sections. On even-numbered years bio sciences hosts it on odd-numbered years planetary science hosted and so on behalf of both sections in the leadership of both sections.
I want to welcome you here. The Sagan Lecture has mostly focused on other worlds reflecting Carl Sagan’s identity as a planetary scientist and astrobiologist, but Carl Sagan was as passionate about the future of life on this world as he was about the search for life on others. And he saw these as related questions. That’s no better expressed than in his book “Pale Blue Dot: A Vision of the Human Future in Space”. He was inspired by the image of Earth taken by the Voyager 1 spacecraft as it passed the orbit of Saturn and here’s what he wrote:
The Earth is the only world known so far to harbor life. There is nowhere else, at least in the near future, to which our species could migrate. Visit, yes. Settle, not yet. Like it or not, for the moment the Earth is where we make our stand.
It has been said that astronomy is a humbling and character-building experience. There is perhaps no better demonstration of the folly of human conceits than this distant image of our tiny world. To me, it underscores our responsibility to deal more kindly with one another, and to preserve and cherish the pale blue dot, the only home we’ve ever known.
And it’s in that spirit that I’m thrilled to introduce Ken Caldeira from the Carnegie Institution of Science to get the 2018 Carl Sagan lecture.
Many astrobiologists know Ken for a highly influential paper that you wrote with Jim Lasting in Nature back in 1992 titled, “The Lifespan of the Biosphere Revisited”. And in that paper, Ken and Jim Kasting predicted that we have about a billion years to go before earth can no longer support a plant-based biosphere.
Since that time Ken has focused attention on the less distant future. He’s become a pioneer studying the environmental consequences of climate change and how we might avoid it. Notably, he was one of the first to point out the challenge of ocean acidification. More recently, he’s grappled with how humans might respond to the climate challenge, delving into energy transitions and even climate engineering.
Throughout, Ken has been an inspiration for his combination of creativity and clear thinking and his willingness to focus on key challenges. For this he became an AGU Fellow in 2010.
But he also became one of the more influential science voices reaching across and beyond the traditional science community. And to me, there’s no better example of that than a blog post in 2016 by Bill Gates, who as some of reads widely talks to people widely and blogs prolifically. Gates wrote a blog post in which he described Ken as “my amazing teacher” on matters of climate and energy. And so today we have the good fortune to welcome and honor Ken as our amazing teacher.
So with that, Ken Caldeira
[Applause]
Lecture by Ken Caldeira:
HI. First I’d like to thank Ariel and the Biogeosciences and Astrobiology groups for inviting me to do this lecture. And it’s certainly an honor.
And there’s no image in this talk that’s in any of my other talk so I rapidly tried to throw something together for this.
I was panicking. I’ve been thinking about this talk ever since Ariel asked me to do it having no idea what in the world I was going to talk about. I even expressed my panic on Twitter and got some suggestions but, anyway, here we go.
But as I was googling around looking for things to talk about, I found a 1954 (he’s 18 years old) reading list from Carl Sagan. And below this list of outside reading, there was his course readings. This was for a single quarter of the year.
He’s 18 years old and he’s reading “The Immoralist” by Gide. He’s reading Shakespeare’s “Julius Caesar”, a couple of books of Plato. First of all, I don’t want to compare myself to Carl Sagan, but it reminds me a little bit of my reading when I was in high school. And it just goes to the depth of interest, and that it’s not just about science but there’s some merging of the science and humanities to be a full human being.
Scientifically, he’s known for a number of things and sure David Grinspoon and others could expand on this more, but one was the synthesis of amino acids abiotically.
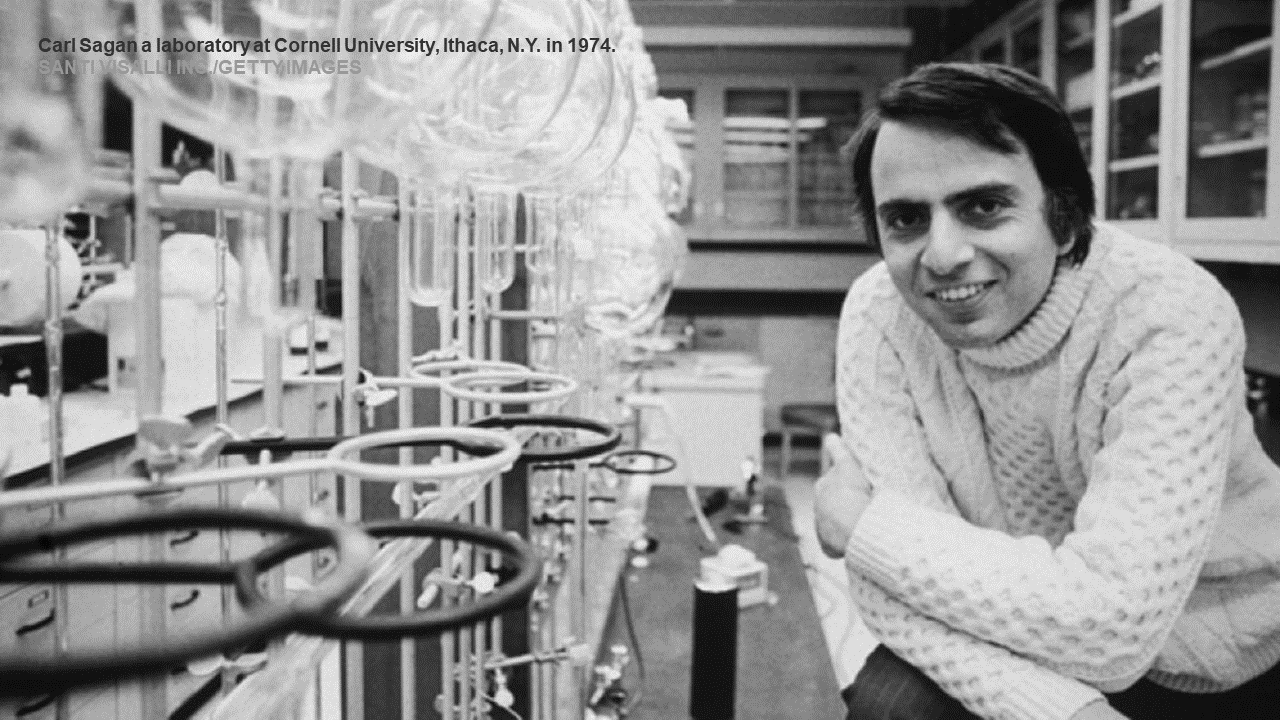
But he had a long career at Cornell as a scientist and obviously like all of us had a personal life in addition to a scientific life.
My first connection, the first time Carl Sagan penetrated my mind, was this book, “Dragons of Eden”.
It’s forty years ago or so that this book was published and some of my memory of it is forty years old. I didn’t go back and reread it but what I remember from that this book was he was writing about how we have this lizard brain that’s our basic emotional structure of fear and desires and hunger and so on, and then over this is lizard brain we have this neocortex that’s our super-ego or more rational decision-making overlay. Maybe it’s also going back to almost a Freudian id and super-ego but putting it in evolutionary terms that we have this basal brain and its overlay. And to me this was really remarkable.
I don’t have any first-hand evidence, but I’ve been told that he was able to write these books essentially dictating paragraph after well-formed paragraph and then getting back the notes of what he dictated and just making minor corrections on that. And I don’t know if that story is true but even if it’s partially true there’s obviously a mind that’s able to think coherently about a wide diversity of issues. And so this mind that’s willing to think about astrobiology and so on but also write books about evolution of consciousness is really amazing.
I was testing out some ideas in my department for this talk and have some speculations about evolution of consciousness, but we’ll see if we get to it. My department mates strongly suggested that I not talk about it.
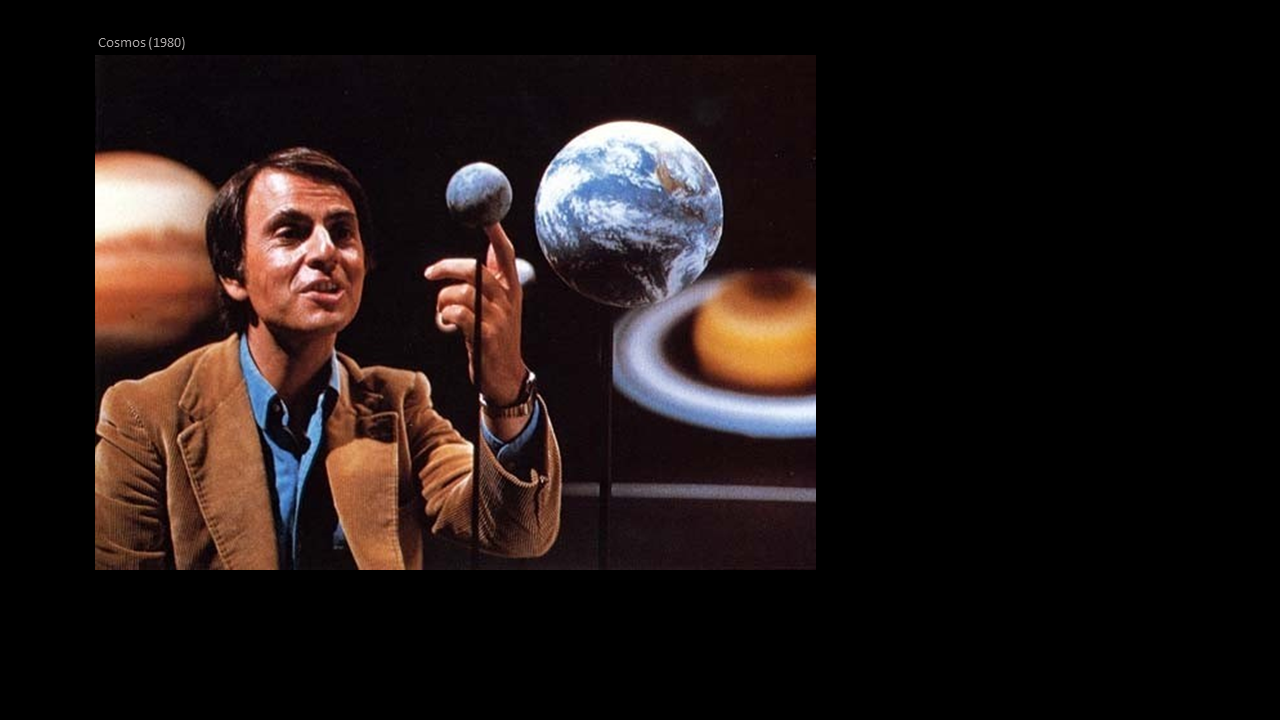
After reading Dragons of Eden, the next thing was Cosmos. It was more or less around 1980 and this galvanized not only me but stimulated the entire country to be thrilled about space travel and space exploration. And this was at an important time because through the 60s there was all of this hullabaloo around landing on the moon and then by 1980 there was low interest in space travel. Carl Sagan’s almost single-handedly generated enthusiasm among broad swatches of the population in space exploration and, in general, broader curiosity and quest for knowledge.
I remember also at that time there was two quotes that stuck with me from Carl Sagan that I didn’t even realize that he was the one who said these quotes. I’ve said these things to other people not knowing who said them originally.
And this one I like because I always I’m always feeling like I have a gut feeling of what’s right or wrong and then there’s this famous quote from Carl Sagan:
“But I try not to think with my gut. If I’m serious about understanding the world, thinking with anything besides my brain, as tempting as that might be, is likely to get me into trouble.” — Carl Sagan
This is certainly true and would probably be good if some of our political leaders would adopt this thought process.
The other quote that that I didn’t realize that is attributed to Carl Sagan is:
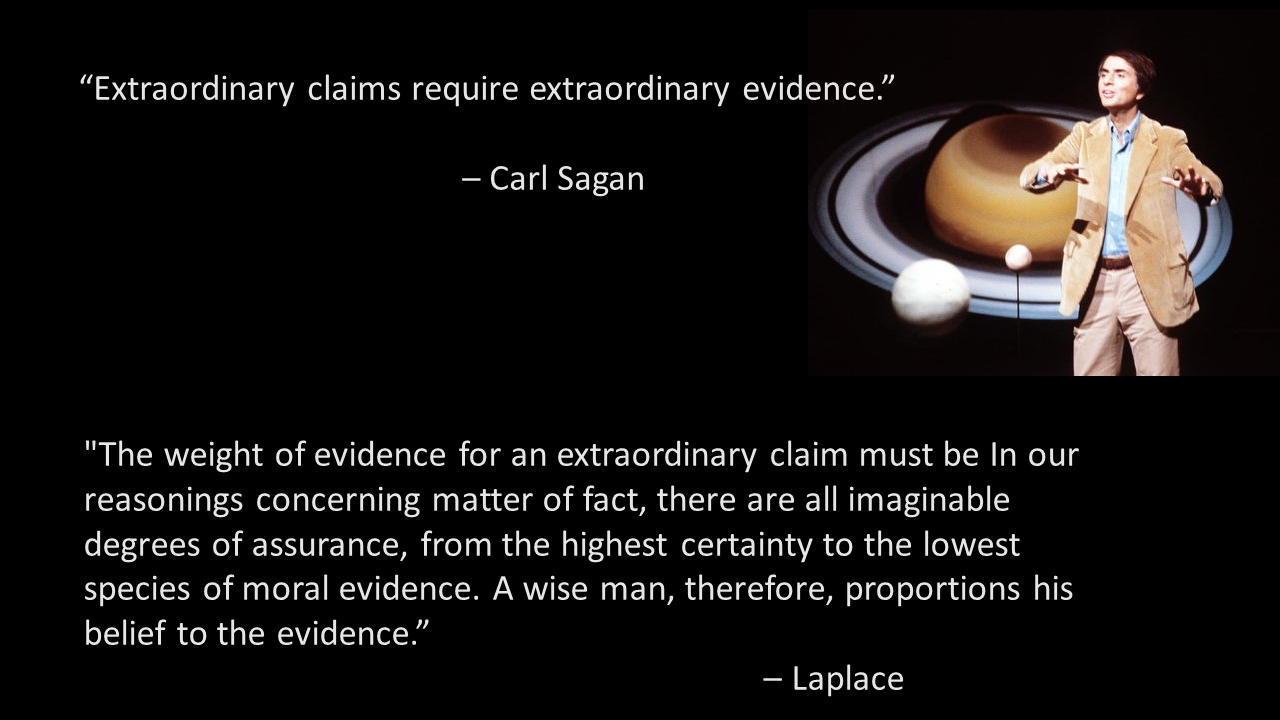
“Extraordinary claims require extraordinary evidence.” — Carl Sagan
which is something I frequently say. In fact, I said this in a review I did recently without knowing it was a Carl Sagan quote.
And of course no brilliant comment like this springs from nowhere. Any time you say anything other people have said something similar earlier, so there are other earlier claims to this type of quote. One early claim is Laplace. In a less pithy way basically said a similar thing.
[“The weight of evidence for an extraordinary claim must be proportioned to its strangeness… . In our reasonings concerning matter of fact, there are all imaginable degrees of assurance, from the highest certainty to the lowest species of moral evidence. A wise man, therefore, proportions his belief to the evidence.” –Laplace]
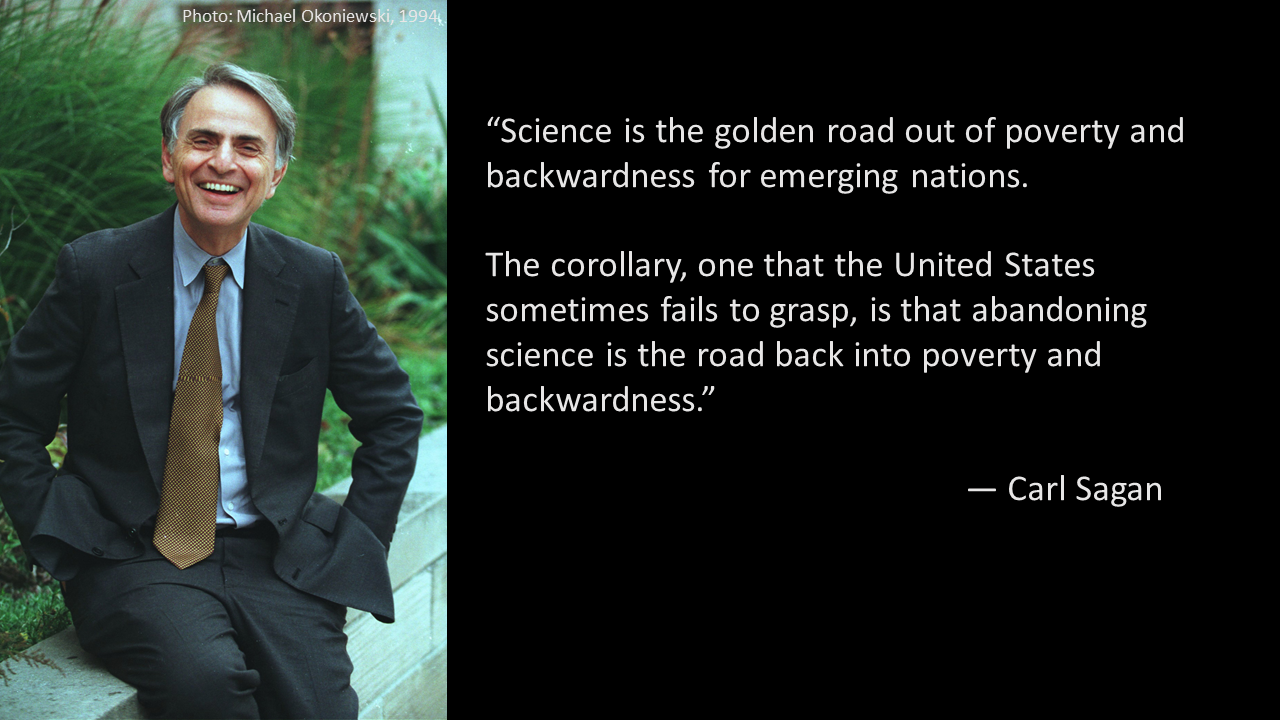
One thing important that I alluded to is that Carl Sagan wasn’t only interested in astronomy and astrobiology, but also how well people were living here on Earth. And he was a believer in the power of curiosity the power of knowledge and the power of science. There’s this quote here:
“Science is the golden road out of poverty and backwardness for emerging nations. The corollary, one that the United States sometimes fails to grasp, is that abandoning science is the road back into poverty and backwardness.” — Carl Sagan
This statement has perhaps greater resonance today than it did when it was first uttered. This confidence that it was through science and technology and understanding that we were going to solve our problems is an important message for today.
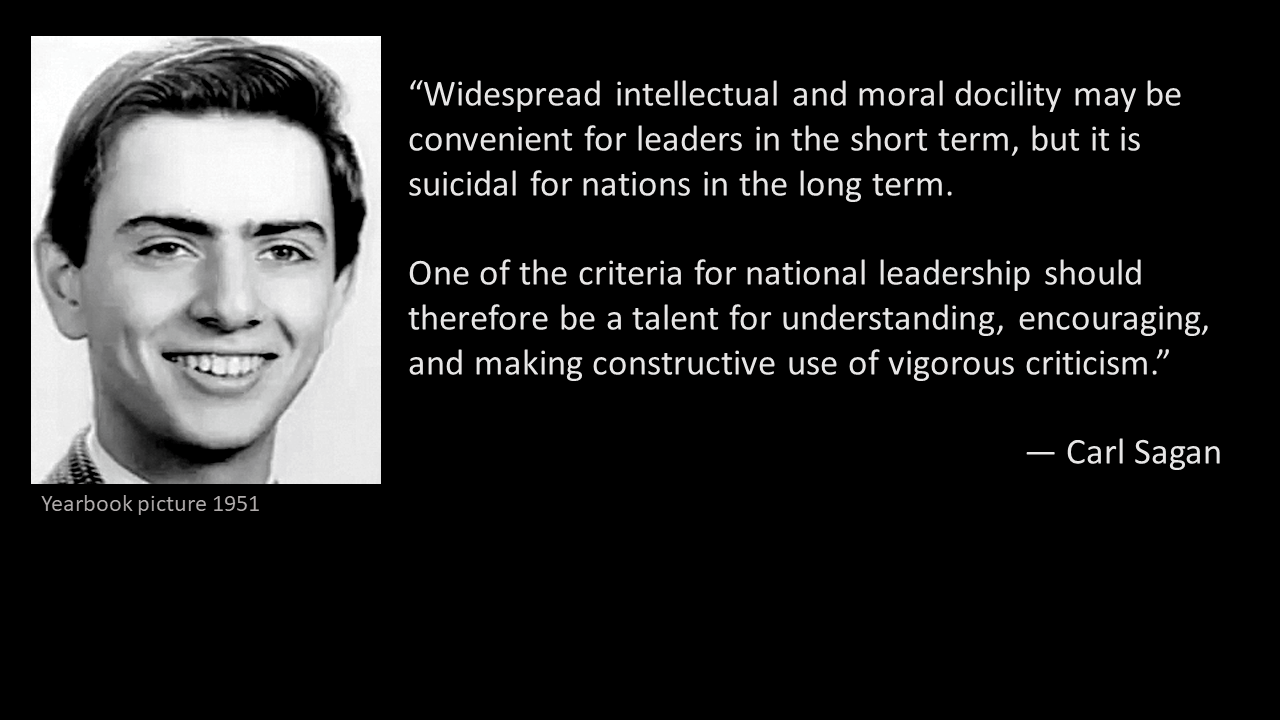
Again, this seems to resonate more with our current political leadership than it did back when Carl was around:
“Widespread intellectual and moral docility may be convenient for leaders in the short term, but it is suicidal for nations in the long term.
One of the criteria for national leadership should therefore be a talent for understanding, encouraging, and making constructive use of vigorous criticism.” — Carl Sagan
Certainly our current political leadership is far from this.
Another thing, and I’ve seen this unfortunately too many times and one sees it increasingly as one grows older, is that we are intellectual and social organisms but we’re also biological organisms. And eventually our biological functioning, our homeostatic systems, fail. And for Carl Sagan it was a failure to make red blood cells and that led him to a premature death.
I hadn’t recalled that he had died at such a young age. When I was 20, 62 didn’t seem like such a young age but now that I’m here, 62 seems way way, way, way, too early. It’s just the tragedy and one wonders what he would have done if he had another 30 years or so.
So with that I’m going to step out of this Carl Sagan review section and go into a more question-asking discussion.
I went on Twitter and just said ‘oh I’m panicking’. What should I talk about? And one of the postdocs in my group responded back, and it doesn’t really fit in my talk but I thought it would be just worth throwing out to ponder. She said “We’re spending all this effort to search for life on other planets and meanwhile we’re destroying all these ecosystems here on earth.” I’m just going to throw that out here because I don’t know how to deal with this other than to say that that these two quests are not zero-sum and that appreciating life here on earth is not inconsistent with searching for life on other planets. We need to embrace both of these objectives or certainly we need to embrace the objective of not destroying things here on earth and at least think about our broader context. I thought this was worth taking note of.
But the basic theme I wanted to talk about is this question: “Can organisms be wildly successful at planetary scale without destroying the conditions that allow them to them to succeed?”
For astrobiology, this is a question of the probability of finding advanced life on other planets. Is advanced life necessarily short-lived because they develop technologies and produce wastes that ultimately make that that class of organisms unable to persist on the planet? Maybe advanced technological societies are very ephemeral and it’s not possible for them to be sustained for a long amount of time. But maybe it is possible to make them sustained. I will come back to this question. I just want to have you’d have this in your mind as the framing question that is important for astrobiology. But, obviously, for all of us living on the planet this is a central question.
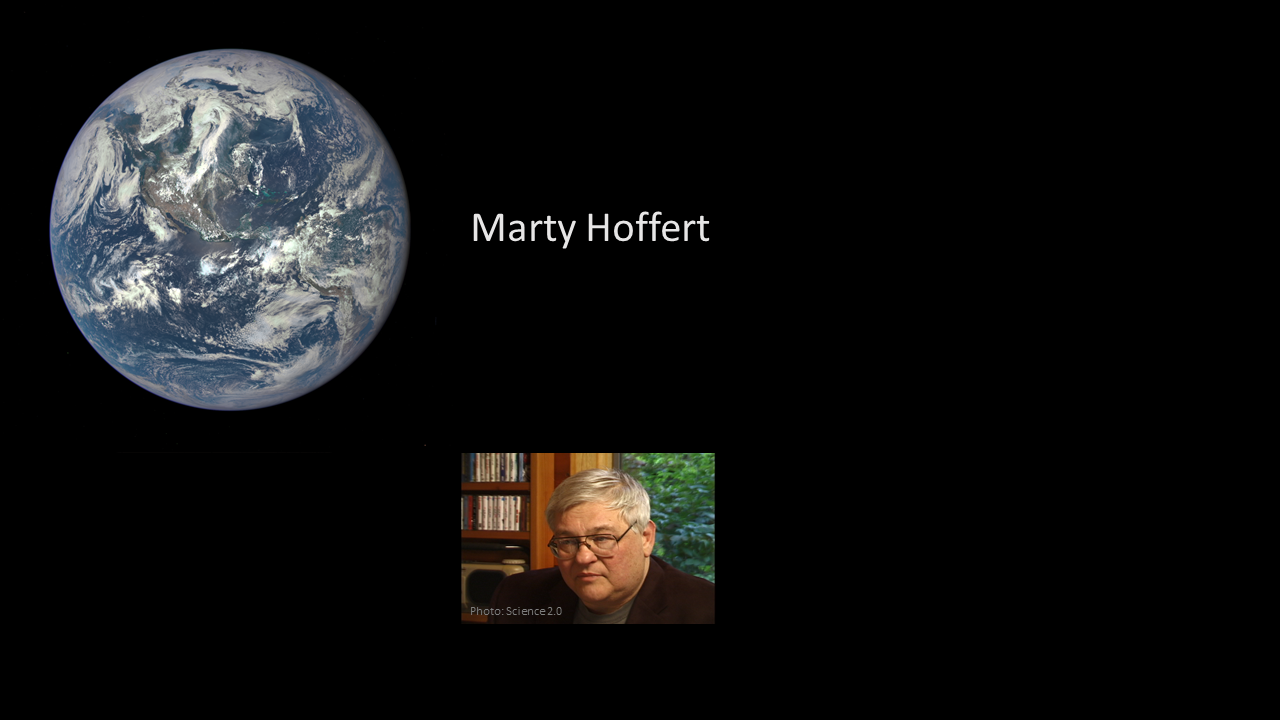
I was fortunate enough to go to New York University for a PhD, which maybe is not one of the premier places, but at the time Tyler Volk was there (who is in the audience) and Marty Hoffert was running the department and Brian O’Neill was there and Francesco Tubiello and a few other people who are in the audience today.
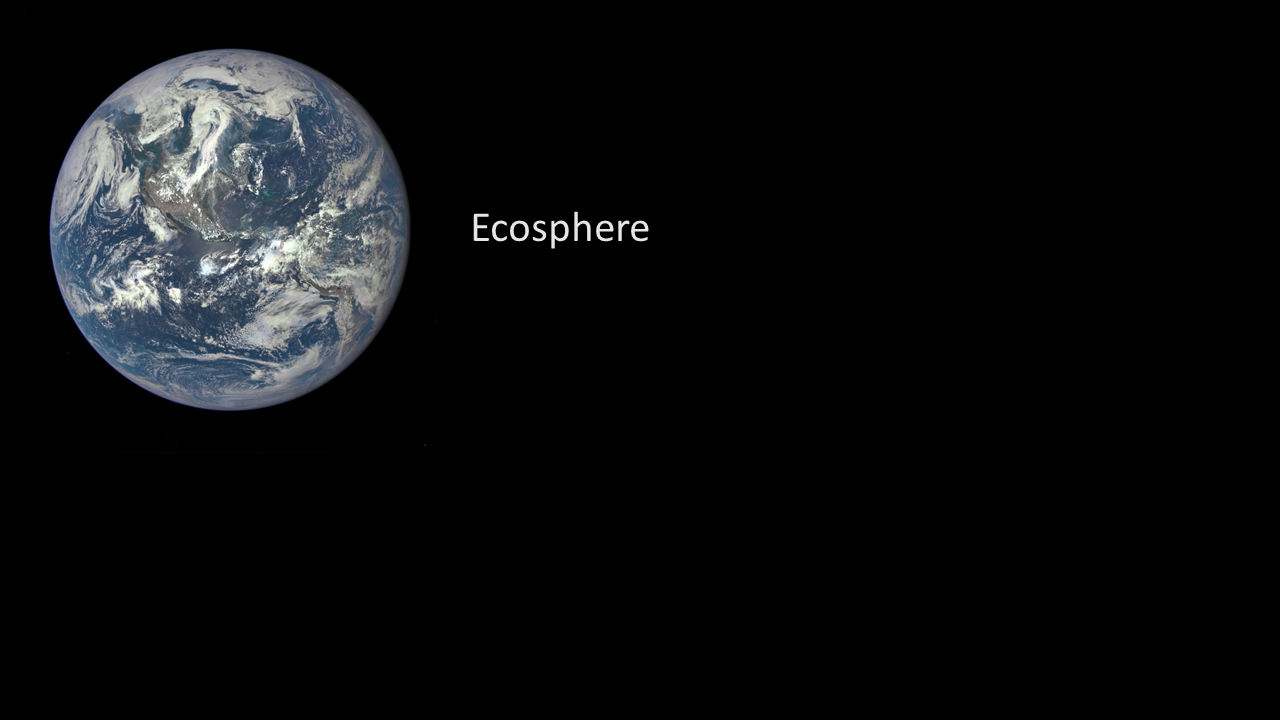
The first thing I did when I got there was model a thing called Ecosphere. It was a glass ball with some water in it and it had brine shrimp in it some algae and bacteria. The idea was you would put it in your window and it would be a materially closed system but open to energy. The idea was that for a long time it would cycle all the material 100% and be energetically open and you’d have a closed ecosystem. Tyler at the same time was working on closed ecosystems for missions to Mars. Obviously there’s some cometary material and other things coming into the planet but more or less than planetary scale that ecosphere is a metaphor for the planet.
Another way of looking at it if we want to have an advanced industrial society that doesn’t accumulate wastes in the environment we might need to think about whether we can make our industrial ecology more like Ecosphere.
There was a paper on this Ecosphere in a journal called Ecological Modeling. As a Master’s student, I coded that up and then tried to put an evolutionary overlay into it. What if we had different plankton and different bacteria competing with each other? How would evolution work in such a thing? That ended up being a paper I did in Nature on evolutionary pressures on planktonic dimethyl sulfide emission.
Can we operate our modern industrial society closer to this materially closed system but be energetically open?
One of my big influences through this time was Marty Hoffert. I remember at that time, this was now the 1980s, that that Berner et al. had come out with the BLAG model, and Walker, Hayes and Kasting had come out with the WHAK model. There was this idea of silicate rock weathering controlling atmospheric CO2 concentrations.
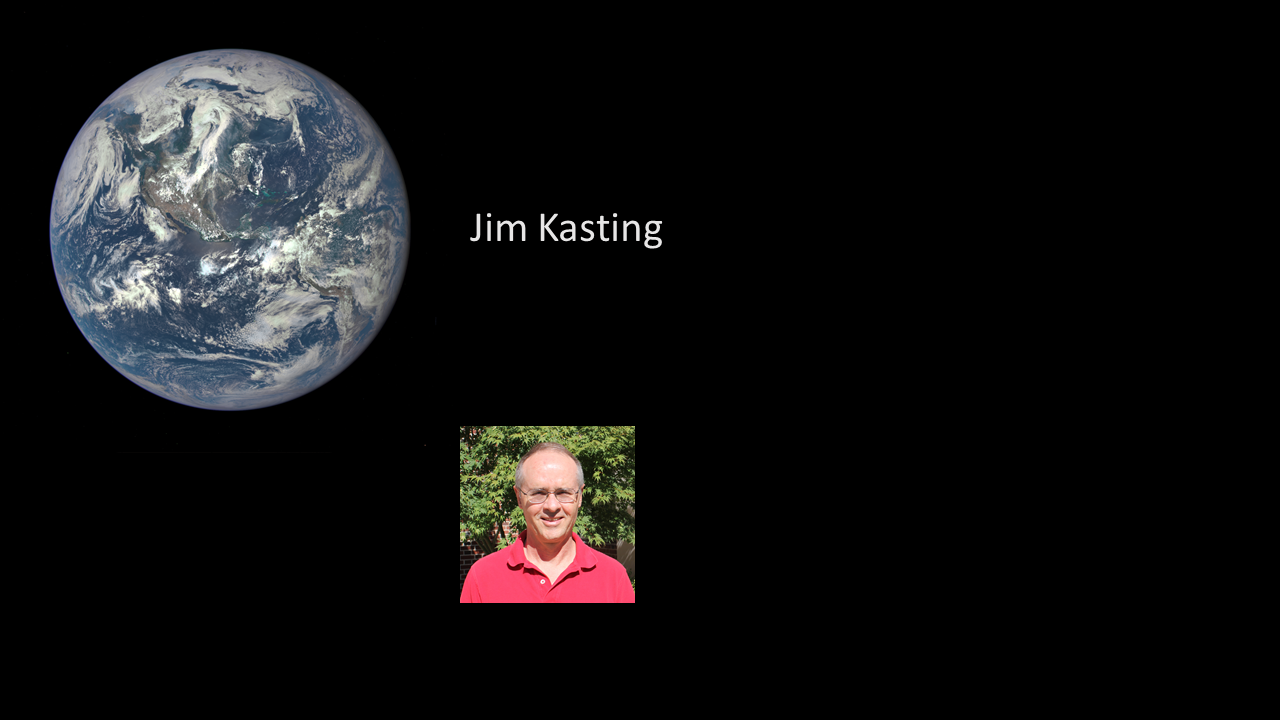
My understanding is that this hypothesis came out from Jim Kasting who was doing a model of oxygen on the early Earth. He had to assume some temperature background conditions and so he came up with this idea that maybe the Urey reactions would control the temperature. Jim Walker led that study and Jim Kasting ended up being last author. This gave some idea that there was some consistency to how planets operate and regulate their temperature.
Back at NYU in the 80s, we were thinking “Oh, if we could only make a model that you’d say what’s the composition of the star and then what are the compositions of the planets and would you have plate tectonics” – the idea of having one unified model that could give you Mars, Earth, or Venus. Also around that time there were questions about the greenhouse effect and how strong would it be and when would we see it. The strongest evidence in support of the global greenhouse effect was that you couldn’t understand the climates of Mars and Venus without looking at the role of CO2 in the climate system.
I remember these 1D models of Martian CO2 concentrations with the CO2 going out at the poles and that sort of thing. That was the beginning for me of looking at earth science as a subset of planetary science.
The other thing that Marty said that I think is really right that is controversial among economists is that different fields like to see themselves as the primary science and every other field as derivative from them. Obviously the physicists have a good claim for being the fundamental science but economists like to think of everything as really all economics and everything’s a subset of economics.
Marty Hoffert used to say, “economics is the study of allocation of scarce resources by one species on the third planet orbiting some minor star in some galaxy that’s basically ignorable.” Economics is an important science but it’s a branch of behavioral biology. We need to take their mathematics with a grain of salt.
Sorry for making this a little autobiographical but I then went to Penn State and this is where I got more connected up with astrobiology because I had an opportunity to work with Jim Kasting.
Jim was super great and one of the greatest people I’ve ever had the pleasure to work with because Jim was somebody who would get more excited about my ideas than I would. There’s really nothing better in a collaborator that have somebody tell you your ideas are good because most people are telling you your ideas are boring and not worth working on, whereas Jim would be like “oh, that’s great”. And so we did things like: we did one paper on early Earth being susceptible to CO2 clouds. Was there a metastable state to early Earth? And then we extended Jim Lovelock’s work on the lifespan of the biosphere (and Ariel alluded to this).
Also Jim brought me to a conference at NASA Ames where I got to meet Carl Sagan. This was my one and only meeting with Carl Sagan. I remember at the time (I know this is maybe not a flattering thing) that he seemed to me a lot more like Mr. Rogers than I had anticipated.
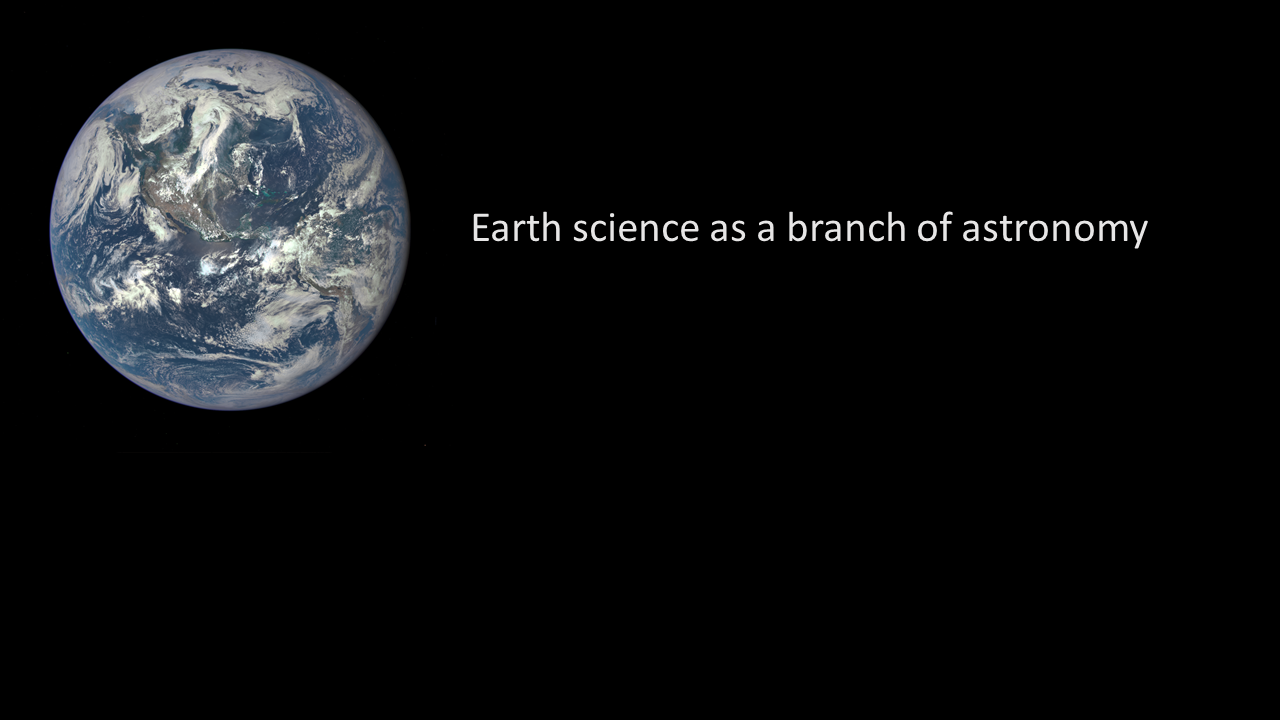
Jim was in a geology department and he said, “look, this Earth is a planet, and earth science is a branch of planetary science which is a branch of astronomy. And so this Geosciences Department is a sort of astronomy department. It is an astronomy department focused on a narrow subset of the universe.” Earth science is a branch of planetary science and it’s about how does this planet function as a planet in some vast universe. That is a very different perspective from those of people who start at very small spatial and temporal scales.
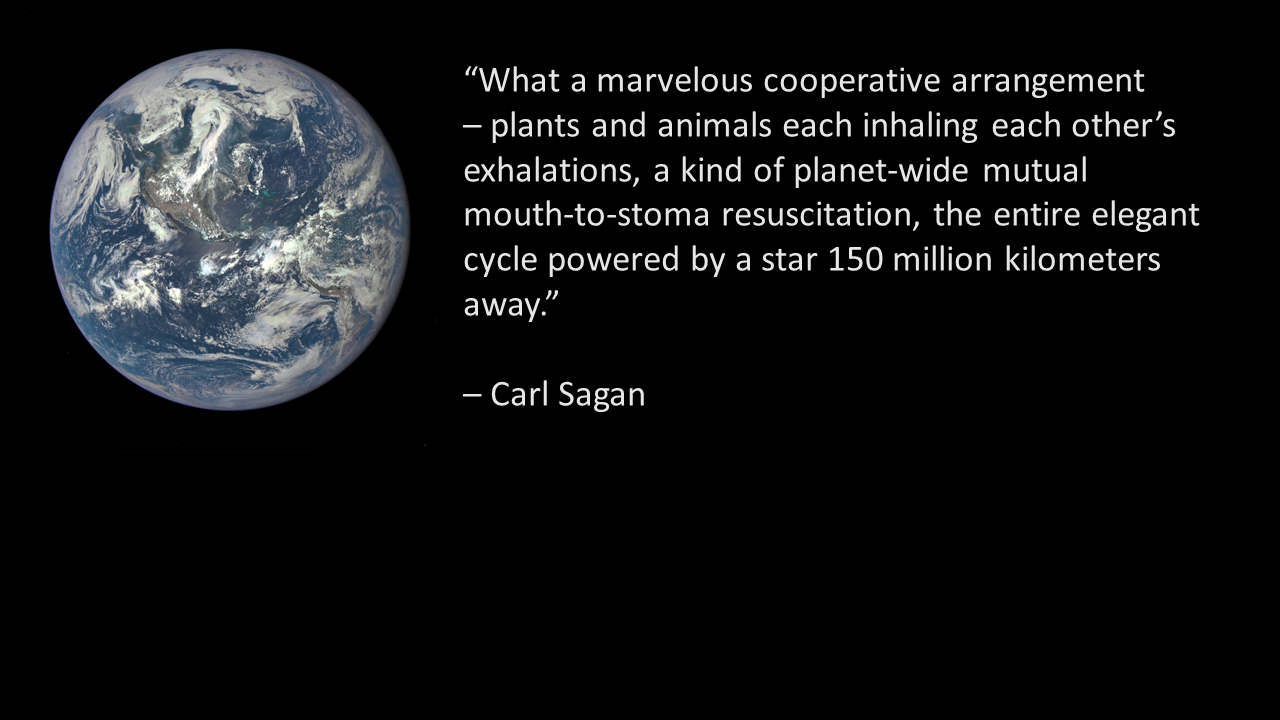
In the 1980s, Jim Lovelock wrote a book about Gaia – about the earth being a homeostatic self-controlling system. And here’s a quote by Carl Sagan that’s in the same direction:
“What a marvelous cooperative arrangement – plants and animals each inhaling each other’s exhalations, a kind of planet-wide mutual mouth-to-stoma resuscitation, the entire elegant cycle powered by a star 150 million kilometers away.” — Carl Sagan
This idea is where I started in graduate school because we were heavily influenced by this Gaia idea. Really, it didn’t make much sense to me because I don’t think plants and animals are cooperating. The plant that gets eaten by an animal was not in a cooperative relationship.
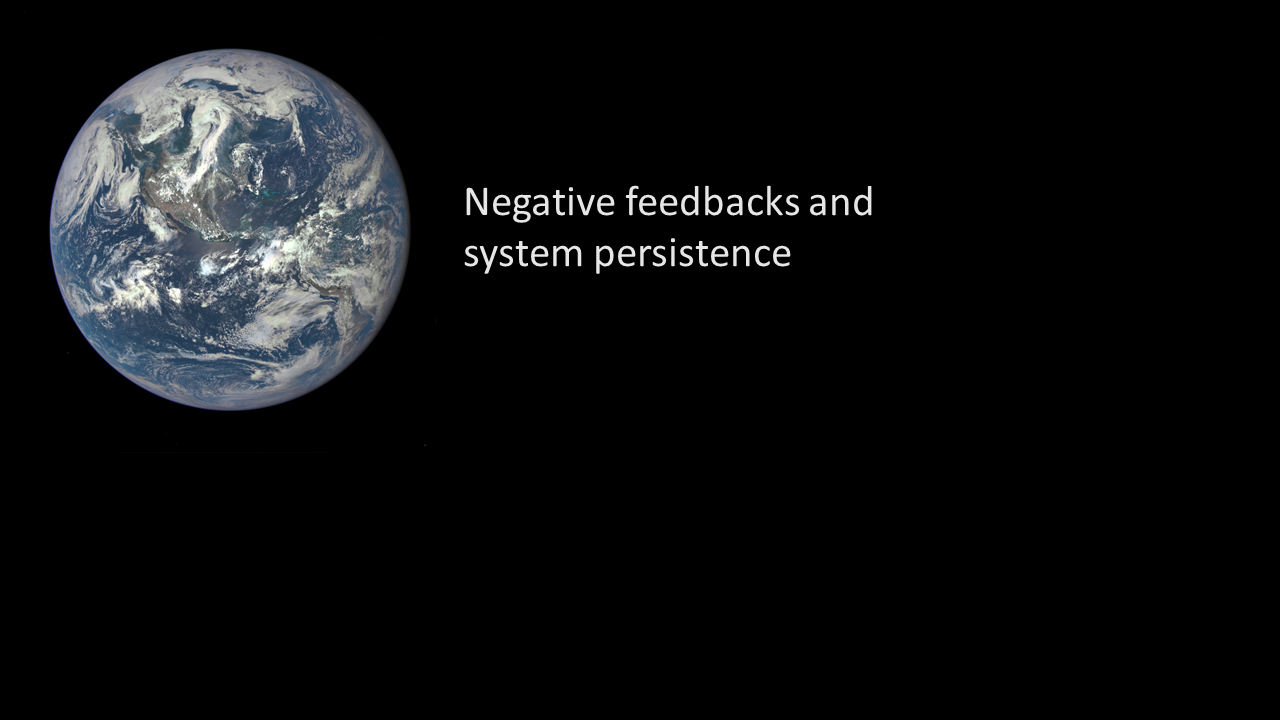
I wrote a paper that was in a Gaia volume from a meeting in San Diego. The way I looked at the Gaia was that if you have a system that’s dominated by positive feedbacks it’s necessarily an unstable system and the system just blows up and converts. So stable systems by their very nature that they’re stable systems are stable because they’re dominated by negative feedbacks.
Let’s just even say you had random different amplifiers and made a million different systems well the you’d find that the population of the persistent ones are the ones that were dominated by negative feedbacks. Just because biology is so big on the planet, some of these systems are going to have biological mechanisms so it just makes sense that that this this planets going to be dominated by negative feedback systems and that that many of those will incorporate biology. It has nothing to do with teleology or goal-directedness.
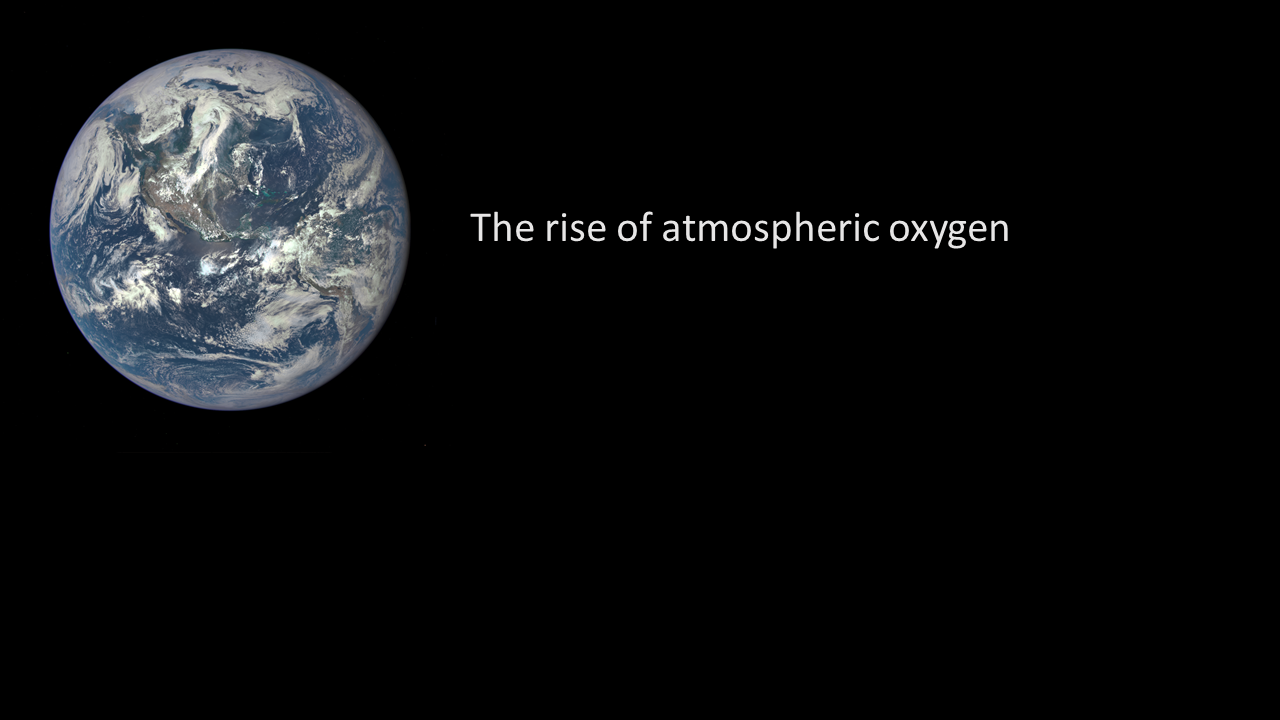
One of the main examples is the rise of atmospheric oxygen a couple of billion years ago. We had anaerobes on this planet they produced oxygen as a waste product and eventually the surface of the earth oxidized and oxygen accumulated (I guess maybe the upper mantle oxidized too) — and the oxygen started accumulating in the atmosphere. And conditions were created that made those organisms not able to live in the environment that had facilitated their evolution.
One of the questions is: Is this going to be our fate also? Is that the way it is for creatures on planets – that if they’re wildly successful they have waste products and eventually those waste products accumulate in the atmosphere or in the environment and then create conditions that don’t allow those organisms to persist anymore? A reasonable first assumption is that this is the way planets with life work – that they produce wastes and eventually produce conditions that are not conducive to their survival.
Of course you can say these anaerobes were highly successful because they’ve created all of us. We are carrying around a bunch of anaerobes in our guts and they’re also in the soils and so on. But is this going to be our fate also – that we’re going to be in some future dome because we’ve destroyed the atmosphere and the waters. Now we create some special environments that we live in.
We are back to this question: Can a civilization be materially closed and energetically open and persist indefinitely? I think the answer has to be ‘no’ because there’s no perfect recycling of materials. There will always need to be material input and material output.
But that ‘indefinitely’ is a rather strong word. The question is can we do it on the billion year time scale. And I think the answer is that if we’re smart we could do it on the billion year time scale. It’s not gonna be perfectly closed and we can’t last forever but it can last long enough. And in this universe where looking 10 years ahead is kind of long distance, worrying about billion year time scales is maybe not something yet in the political system. We can’t last indefinitely but we could last on astronomical timescales.
One of the challenges for doing this is: Can evolution create organisms that can deal with fitness effects that will manifest only in future generations?
Evolution works on the organism level: Does that organism get to reproduce and produce a viable offspring? We’re in a situation now where if we are all just local optimizers, that’s not going to work. And so this transition towards long-term sustainability depends on organisms not worrying about their narrow fitness so much as the fitness of the group. And this is where you get back to the evolutionary theory.
I’m gonna do the “consciousness trophic levels argument”.
When the cow wants to eat of grass why doesn’t that blade of grass run away from the cow?
The answer is energetics. There’s just too low an energy density to sunlight and too low conversion efficiency of photosynthesis for plants to have a high energy lifestyle so they need to be have a low energy lifestyle and not be very motile. This is just a conjecture.
Something that I did a before I went to graduate school, I did a neural model of a sea slug aplysia. You could see from the wiring of the nervous system of the sea slug that it basically has sensors on both sides. If it’s sensing more light to the right the neurons go to the muscles on the left side of its body and it moves a little faster on the left and turns towards the light. You can understand its basic behavior patterns just from the wiring diagram of its nervous system.
But if you start getting to higher trophic levels – say a pack of lions or cats or something or dogs who are trying to chase down a highly motile animal — now you have to think “What’s that animal going to do? What am I going to do in response to what it does? How are other people or other organisms in my social group going to respond to that?” And so you start needing to model this system as: I have a mental model of the world. I’m representing myself as an actor in that world. I’m representing other creatures as actors that are making decisions and I’m trying to think of what-ifs and counterfactuals.
It is through this process of representing world as model and self as actor in the model, and other minds as actors in the models, that we get to consciousness.
Bees are the opposite end. Bees are just eating things that are pretty stable. Pollen is not running away from them and so the bees don’t have to have this mental modeling of what other agents are going to do. Bees have evolved in a way that they really do have this sort of group optimization. Obviously genetically there are reasons why, and so the question is: Can we use our brains to have more of this group optimization and not that short-term local-in-space-and-time optimization?
Depending on how the time was going I was going to go into a bunch of little side things but things got too long …
Consciousness and trophic levels — which people want me not to do but I do think that the basic point there is that to evolve consciousness on a planet you have to get to a point where there’s several trophic levels because you need really high energy organisms that are pursuing other high energy organisms, that need to keep mental models of the situation representing self as actor, and that’s where consciousness comes from.
Statistics of impacts and mass extinctions — I’ve been doing a bunch of work with Mike Rampino over the years and I never know what to think about this. Looking at life on Earth (and Mike is convinced and he’s convinced me even though I don’t really like it), if you look at the mass extinctions on Earth and then and also even the secondary ones and then you look at the statistics of impacts and things like flood basalts and that all these things do seem correlated. I was always wondering like how much of this is coming out of cherry-picking datasets. I’m working with Mike on these ones and we have probably done at least a half dozen papers on these correlations over the years. Mike is usually coming up with the numbers I’m doing the statistics and I’m always a little skeptical of the whole thing but it does it’s the same numbers keep popping out of different data sets. It does seem that at least there’s some extraterrestrial pacemaker to some punctuated events in Earth history, and that mass extinction events with extraterrestrial causation, or at least where the extra-terrestrial component is a substantial factor, does seem to be a characteristic of life on this planet and likely on other planets.
One of the things that have come up in this context is that we were doing some work in the Great Barrier Reef looking at the effects of ocean acidification on coral reefs. Elizabeth Kolbert came out and visited us and we ended up as a chapter in her Pulitzer Prize-winning book and which she called “The Sixth Extinction”. One of the questions is: Are we right now facing anything that’s at the scale of the five previous extinctions? Despite liking Elizabeth and liking her book and all, I don’t think what we’re doing now is anywhere near the end like the end Cretaceous extinction event. What we’re seeing we’re seeing a terrible loss of biodiversity but a lot of it is the bigger more charismatic stuff and stuff with economic value or stuff that’s not widespread. I think it’s tragic. I don’t think it’s at the same scale of anywhere close to the end Cretaceous extinction.
Life outside of traditional habitable zones — One of the things that’s really been interesting recently … Back when I was working with Jim Kasting, always the focus was on habitable zones and how did the silicate weather feedbacks affect the habitable zones. People didn’t think about how tidal forces could heat moons of outer planets and these tidal forces could make liquid water deep in the solar system. One of the exciting things that’s happened in this whole field since then is this expansion of the notion of what a habitable zone is and how there’s other energy sources other than the star that can support life. Whether that could support anything more advanced than bacterial life is a question.
I’m just gonna run to the end because I’m good running out of time.
How hard is it to destroy modern civilization? — This shows up in the global change discussion a lot. There’s a lot of people who think that global warming is an existential threat to modern civilization. And other people think we’re going to just muddle through. And it’s going to be a cost on society. It will be an existential for some people who lose their livelihood or lose their lives, but as a civilization it’s a challenge but not an existential threat. I tend to be on that side of things.
It’s a little bit like the extinctions. It’s tragic and unnecessary but not an existential threat. To some people and some communities, yes, but not to humanity.
How hard is it to kill off all life on Earth? — Once we were in some meeting and the question came up of how hard it is to kill off all life on Earth. I think that one’s hard unless you melt the planet because you have the deep biosphere you’ve got life all over the place. If you had a Cretaceous type impact, you could maybe kill off modern civilization but it’s really hard to kill off life on Earth without melting the entire planet.
Again, this question here: Can organisms be wildly successful at planetary scale without destroying the conditions that allowed them to succeed?
And the answer is that in most cases organisms would be expected to destroy the conditions that allowed the organisms to succeed but this is not a necessary outcome. And we’re in a special position to affect the answer to this question.
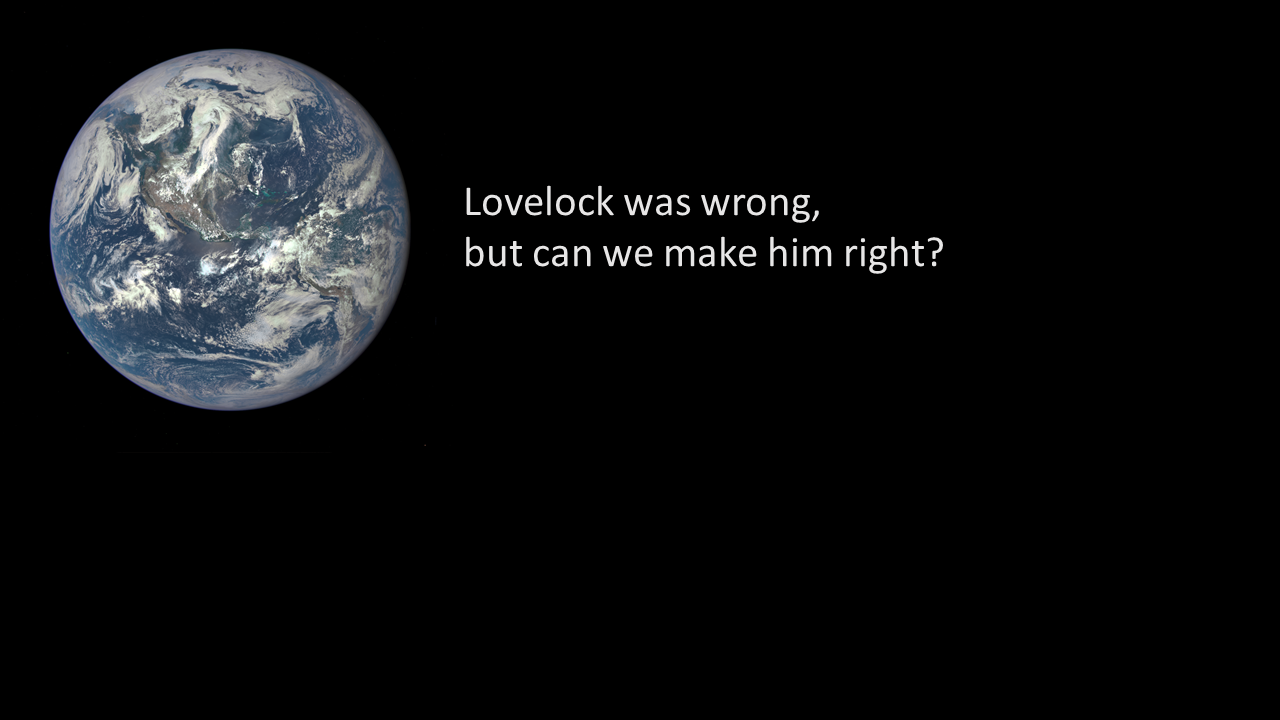
Lovelock was wrong but we can make him right. Lovelock had this idea that there’s all kinds of biological and negative feedbacks in the system and the biology is operating this system in a way that keeps the conditions good for life on this planet. Lovelock was wrong. There is no teleology. There’s no goal directedness to how the planet functions.
Until now.
Because now we have these brains that model ourselves as actors and we think of counterfactuals and consequences of our actions. We have the ability to operate this planet in a goal-directed way.
And being a risk-averse person my goal-directed way of operating this planet is to interfere with natural systems as little as possible. The more we pull back from interfering with natural systems, the more likely we are to persist.
But people can disagree. There are some people who want to terraform Earth and make it nicer. But the main challenge is to make Lovelock right – to operate this planet in a teleological way.
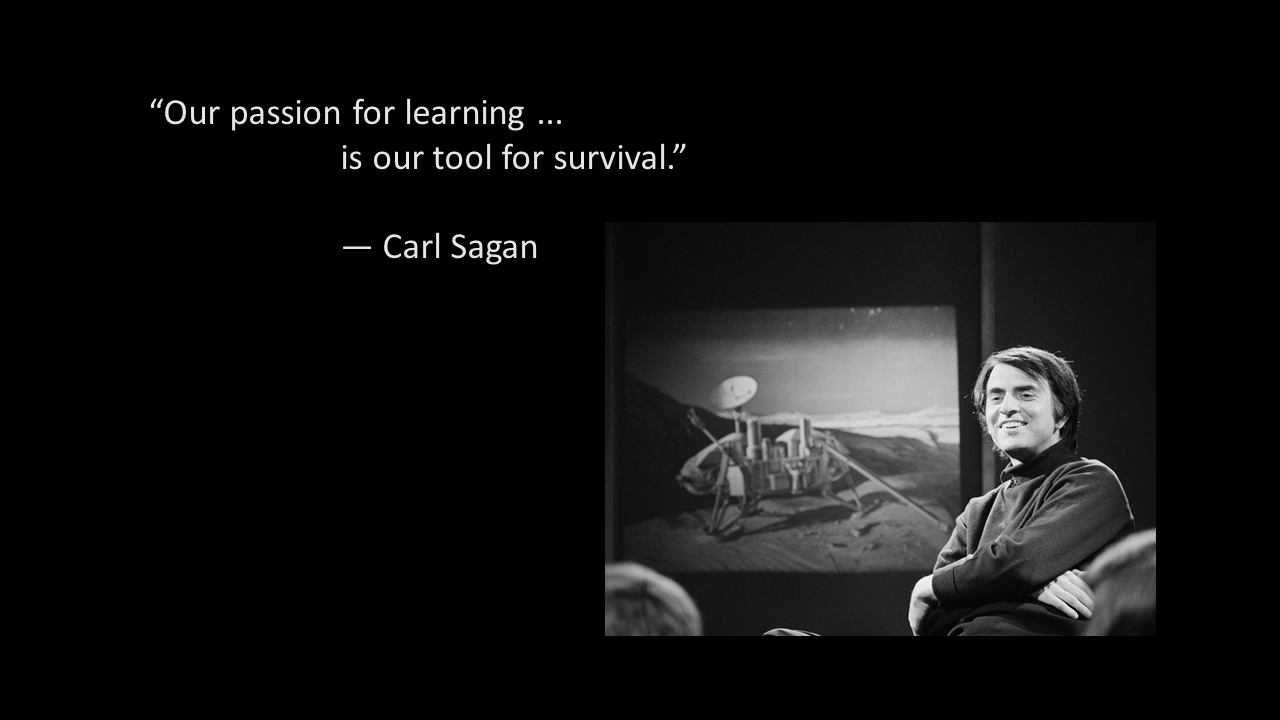
Now coming back to some quotes from Carl Sagan: “Our passion for learning … is our tool for survival.” –Carl Sagan
We learn about this planet, about how it functions. And then we can start operating it a little more cleverly.
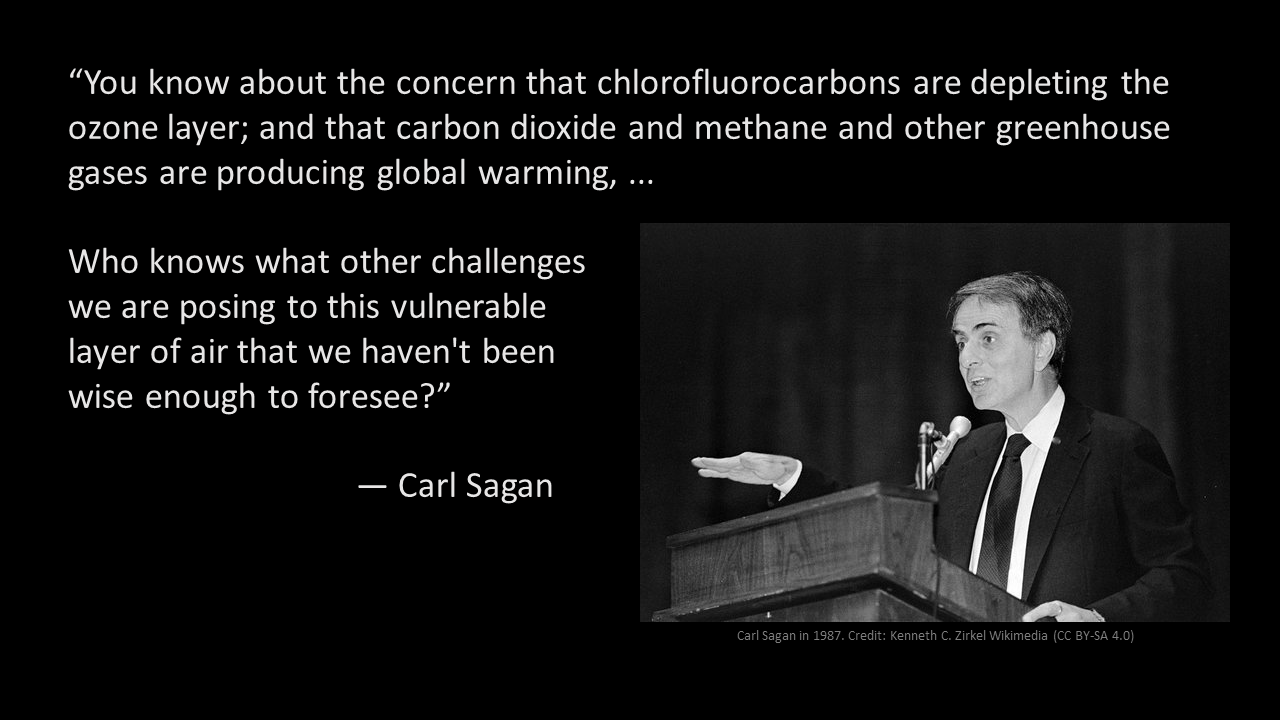
“You know about the concern that chlorofluorocarbons are depleting the ozone layer; and that carbon dioxide and methane and other greenhouse gases are producing global warming, …
Who knows what other challenges we are posing to this vulnerable layer of air that we haven’t been wise enough to foresee?” — Carl Sagan
Our department hopefully is going to hire some new people and one of the things I’ve been arguing is exactly where we should hire is reflected in this quote from Carl Sagan. Over the last century we’ve worried about lead and gasoline. We’ve worried about chlorofluorcarbons destroying the ozone layer, about CO2 and our fuels altering climate, about pesticides so on.
When we solve the climate problem, that is not the last thing. If we solve the climate problem amd we made it so pesticides didn’t kill off all the insects, and got rid of last of the CFCs and so on, something else is going to bite us down the road. Who’s thinking about what comes after the climate problem? What’s the next barrier that civilization is going to run into? We need to be thinking about this now.
Let’s say it was 1918 instead of 2018 and you said okay what science could we be have done in 1918 that would make the world a better place today? I’m doing now energy system forecasting. Energy system forecasting in 1918 would have been a complete waste of time. You wouldn’t have seen wind, solar ,nuclear, or the rise of automobiles, but coming up with new materials, obviously health and education, but coming up with new materials … If you were to come up with silicon chips and carbon nanofibers … All these things in 1918 that would have been great but you also needed to couple that with life cycle analysis so that when we release these new materials into the environment, we understand their long-term effect. These environmental studies is something that if they had done in 1918 could have protected people children from getting lead in their brains. It could have protected us from climate change. And this anticipatory science of what materials can we produce and then what happens when those materials are released into the environment is critical.
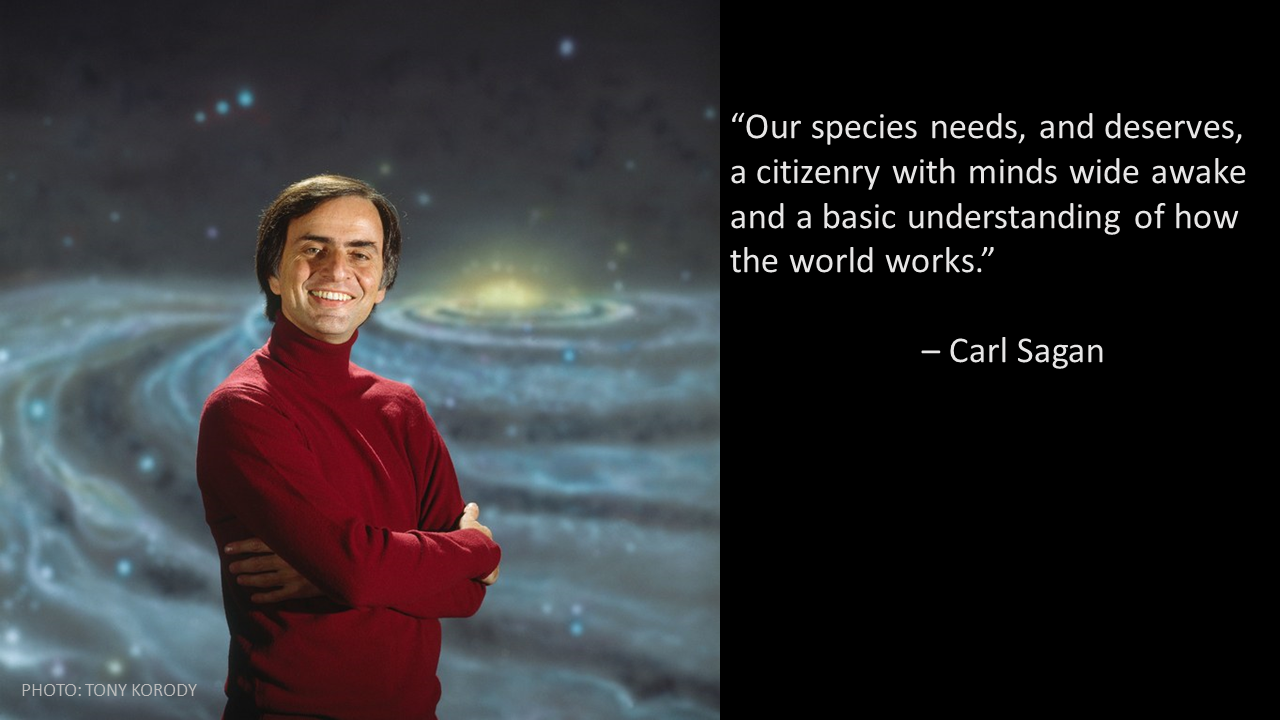
“Our species needs, and deserves, a citizenry with minds wide awake and a basic understanding of how the world works.” — Carl Sagan
Another thing that Carl Sagan pointed out is that democracy depends on an educated population. We obviously don’t have an educated population right now.
I’ve had people email me telling me that I’m a technologist and it’s how bad I am for believing in technology. And I say, “look you’re using a computer to tell me that technology is bad”. People assume a cellphone just works and that’s not technology. Technology is that scary thing.
“We have also arranged things so that almost no one understands science and technology.
This is a prescription for disaster.
We might get away with it for a while, but sooner or later this combustible mixture of ignorance and power is going to blow up in our faces.” — Carl Sagan
Unless people understand something about science we’re not going to be able to deal with our problems properly. We need a population that understands how the world works and can vote appropriately. And this is the centerpiece of my talk: Can we live on this planet a long time and can we get past this a tendency of evolution to optimize the fitness going just one generation forward? Can we can we make Lovelock right? Can we operate this planet for the long term?
“While our behavior is still significantly controlled by our genetic inheritance, we have, through our brains, a much richer opportunity to blaze new behavioral and cultural pathways on short timescales. ” — Carl Sagan
This is what we really need to be doing with our science and with our lives.
Ariel had this quote and so I’m not going to go through it again but just looking at our planet as one of many planets in the universe and realizing that we are on this Ecosphere – the spaceship Earth – and we need to try to help life as we like it persist.
Just to remind you of this other quote: “Extinction is the rule. Survival is the exception.” — Carl Sagan
We’re an exceptional species but we need to work at it.
Question Period:
Note that questions were not caught by the transcription, so these are lightly edited versions of Ken Caldeira’s answers to questions.
I said two things that were contradictory one is that that we have to learn how to run the planet and the other thing is I think that I my bias is towards interfering in natural systems as little as possible.
I don’t see that as a contradiction in that my feeling is that unless you really understand complex systems well, interference in them is likely to produce unanticipated consequences and is dangerous. If the natural system in which we evolved is providing us a pretty good home then maybe a risk-averse way to run that planet is to let that natural system go on.
I did some work with Edward Teller and he wasn’t worried so much about global warming as he was about going into the next ice age. He asked whether we, for the next Ice Age, we could engineer our way out of that. Obviously this interference is very dangerous.
Let’s say is the Sun heats up and now we’re not worrying about the next decades but say a billion years. We can do things to put particles either at the L1 point between the Earth and the Sun or in orbit around the earth or in the stratosphere and reflect additional sunlight away from the earth and extend the lifespan of the biosphere.
So I think right now our best course is to minimize intervention in the system but that eventually that it might be in people’s interest to take some active role.
But right now keeping the hands off the rudder is the best course of action. And right now unfortunately we we’re intervening in the system without understanding — or with understanding and without caring — and we have to stop doing that.
Back to economics a little bit …
We evolved as local optimizers but we are heavily culturally influenced. Camus, who Sagan was reading, had written about imagining Sisyphus as happy pushing that stone up the hill. And that you wonder about the people who built the Nortre Dame cathedral as a multi-generational project that was aspirational towards some idea of permanence. Are these are sort of serfs working on this thing and just because they need to get money for food or did this gave people meaning to people to lug these stones and build Nortre Dame. We can get collective me out of out of a project that would be positive for all of humanity and that in a way this sort of economics and even evolutionary theory emphasizing self-interest and narrow personal gain ….
I think a lot of us are motivated by approval of our peers, by wanting a feeling of meaning in our lives and so on. And not everything we do is narrowly self-interested. And maybe if in our culture we tried to emphasize more doing things for the public good that maybe more people would start doing things for the public good.
I don’t know how much time we have but okay.
I think intelligence is pretty easy to evolve that that I read this nice book by Frans de Waal. It was “Are We Smart Enough to Know How Smart Animals Are?” and a main point is that brains have a cost. They require a lot of energy so it’s resources won’t be used for anything else. Frans de Wal said basically that we have the brains that maximize our fitness. If you look at an interesting cases, look at octopus because most other intelligent organisms are vertebrates and we have come from the same line of brain function. Our brain architectures are the same so octopus are interesting to look at because they’re invertebrates. They have a distributed brain so they can tell one of their arms to to explore over there and the actual detailed exploration will be done in the intelligence of that arm. It will be done in the arm rather than in central processing.
But octopus only live a year or two. They’re carnivores. They invade disturbed places and and so they need to go in and have that dexterity to figure out how to adapt to a new situation and, having intelligence, know how to get prey. That’s where they need to think about what ifs — with the prey.
The fact that on this planet right now some forms of intelligence develop both in vertebrates and invertebrates and that’s just at this time now…
Why aren’t octopus more intelligent? Because it wouldn’t improve their fitness to be more intelligent.
It tends to be carnivores and social animals … and so social carnivores are the intelligent animals because they need to coordinate with other beings and they need to go after motile organisms.
Anytime you have high number of trophic levels and social organization you’re likely to get consciousness.
Unfortunately, there is there another session coming in here is somebody like waiting to use the room …
I don’t but I don’t think we have time to go into that so I’m happy to talk to you afterwards but I don’t have concrete ideas on what to do there unfortunately I said to be broadly educated and creative.
But, what?
Oh this Sun — its the stellar evolution, the Sun is getting hotter and eventually we’ll lose our liquid water.
Scientists need a system to help them find the papers that are really worth taking the time to read carefully.
Right now, working scientists and those who would like to follow scientific literature have difficulty wading through the thousands of papers that are published every day to get to the papers that are worth reading.
The problem is caused by the emphasis on quantitative publication-based metrics to assess scientific productivity. These metrics give authors incentive to publish many papers describing micro-advances, and to divide a single integrated study into several papers. (These metrics also provide incentives to add co-authors who have contributed little, but that is another story.)
Working scientists, and people who would like to follow the work of scientists need help.
The following proposal is a rough sketch and not all of the details have been worked out.
Moss, Wunderlich Park
The basic idea is to create an online platform that would help people to understand what they should read to be up on the scientific conversation in a scientific topic area or sub-discipline.
The platform would be about recommending reading.
It would not be about criticizing content that is found in the literature, and it is not about saying what not to read. Aside from looking at the statistics of recommendations, the only action someone can do is recommend a paper for people interested in a topic area.
It is inspired by things like Stack Exchange and Reddit. In the ideal set-up, perhaps on some platform similar to Google Scholar, there would be a way to tell the system that you recommend people interested in, for example, metamorphic petrology to take the time to read this paper.
Key would be in enabling the sorting of recommendations in different ways.
Disciplinary expertise. Recommendations from different people could be weighted differently depending on how many (weighted) recommendations their own work has gotten within that topic-area (sub-discipline). So, a metamorphic petrologist whose work has gotten many recommendations would have more influence in ranking of papers within the metamorphic petrology topic area.
Different time periods. One could look at recommendations as a time-series, and use the net-present-value of weighted recommendations-instances to sort reading recommendations. If the user wanted to see what the most important papers were on the decadal time scale, they could use a decade as the discount rate. If the user wanted to see what the most important papers were over the last weeks, they could discount on a one week time scale. The time discounting could also be used to reduce the weight of recommendations from people who make recommendations very frequently.
Sorting and searching. While the institution that hosts the database should provide basic search functions, if the resulting database is open access, as it should be, many people could provide services filtering and sorting results in different ways. One could imagine constructing associations between topic areas by looking at papers recommended in more than one topic area, and searching for important papers to read based on those associations.
Questions remain:
— How should other aspects of the platform be designed, including how to create topic areas within the system?
— To what extent can or should anonymity be provided?
— How can we design a system such that when people try to game the system, they are doing what is best for the system?
Of course, proposals like this suffer from a chicken and egg problem. If everyone were already be using a system like this, the system would be useful and busy scientists would have incentive to use it. But if nobody is using the system, then nobody has incentive to contribute to it. Therefore, a system like this would need to be initiated by people with some standing, perhaps Google, professional associations, or national academies.
It would be great if there were some kind of community-wide reading recommendation service with the granularity to be useful even on topics of extremely narrow interest.
This rant is from an email sent to my research group. It seems that some of us have been asking questions like, “What can I do with a climate model that has not already been done?” If this is the question we are asking, then we are asking the wrong question.
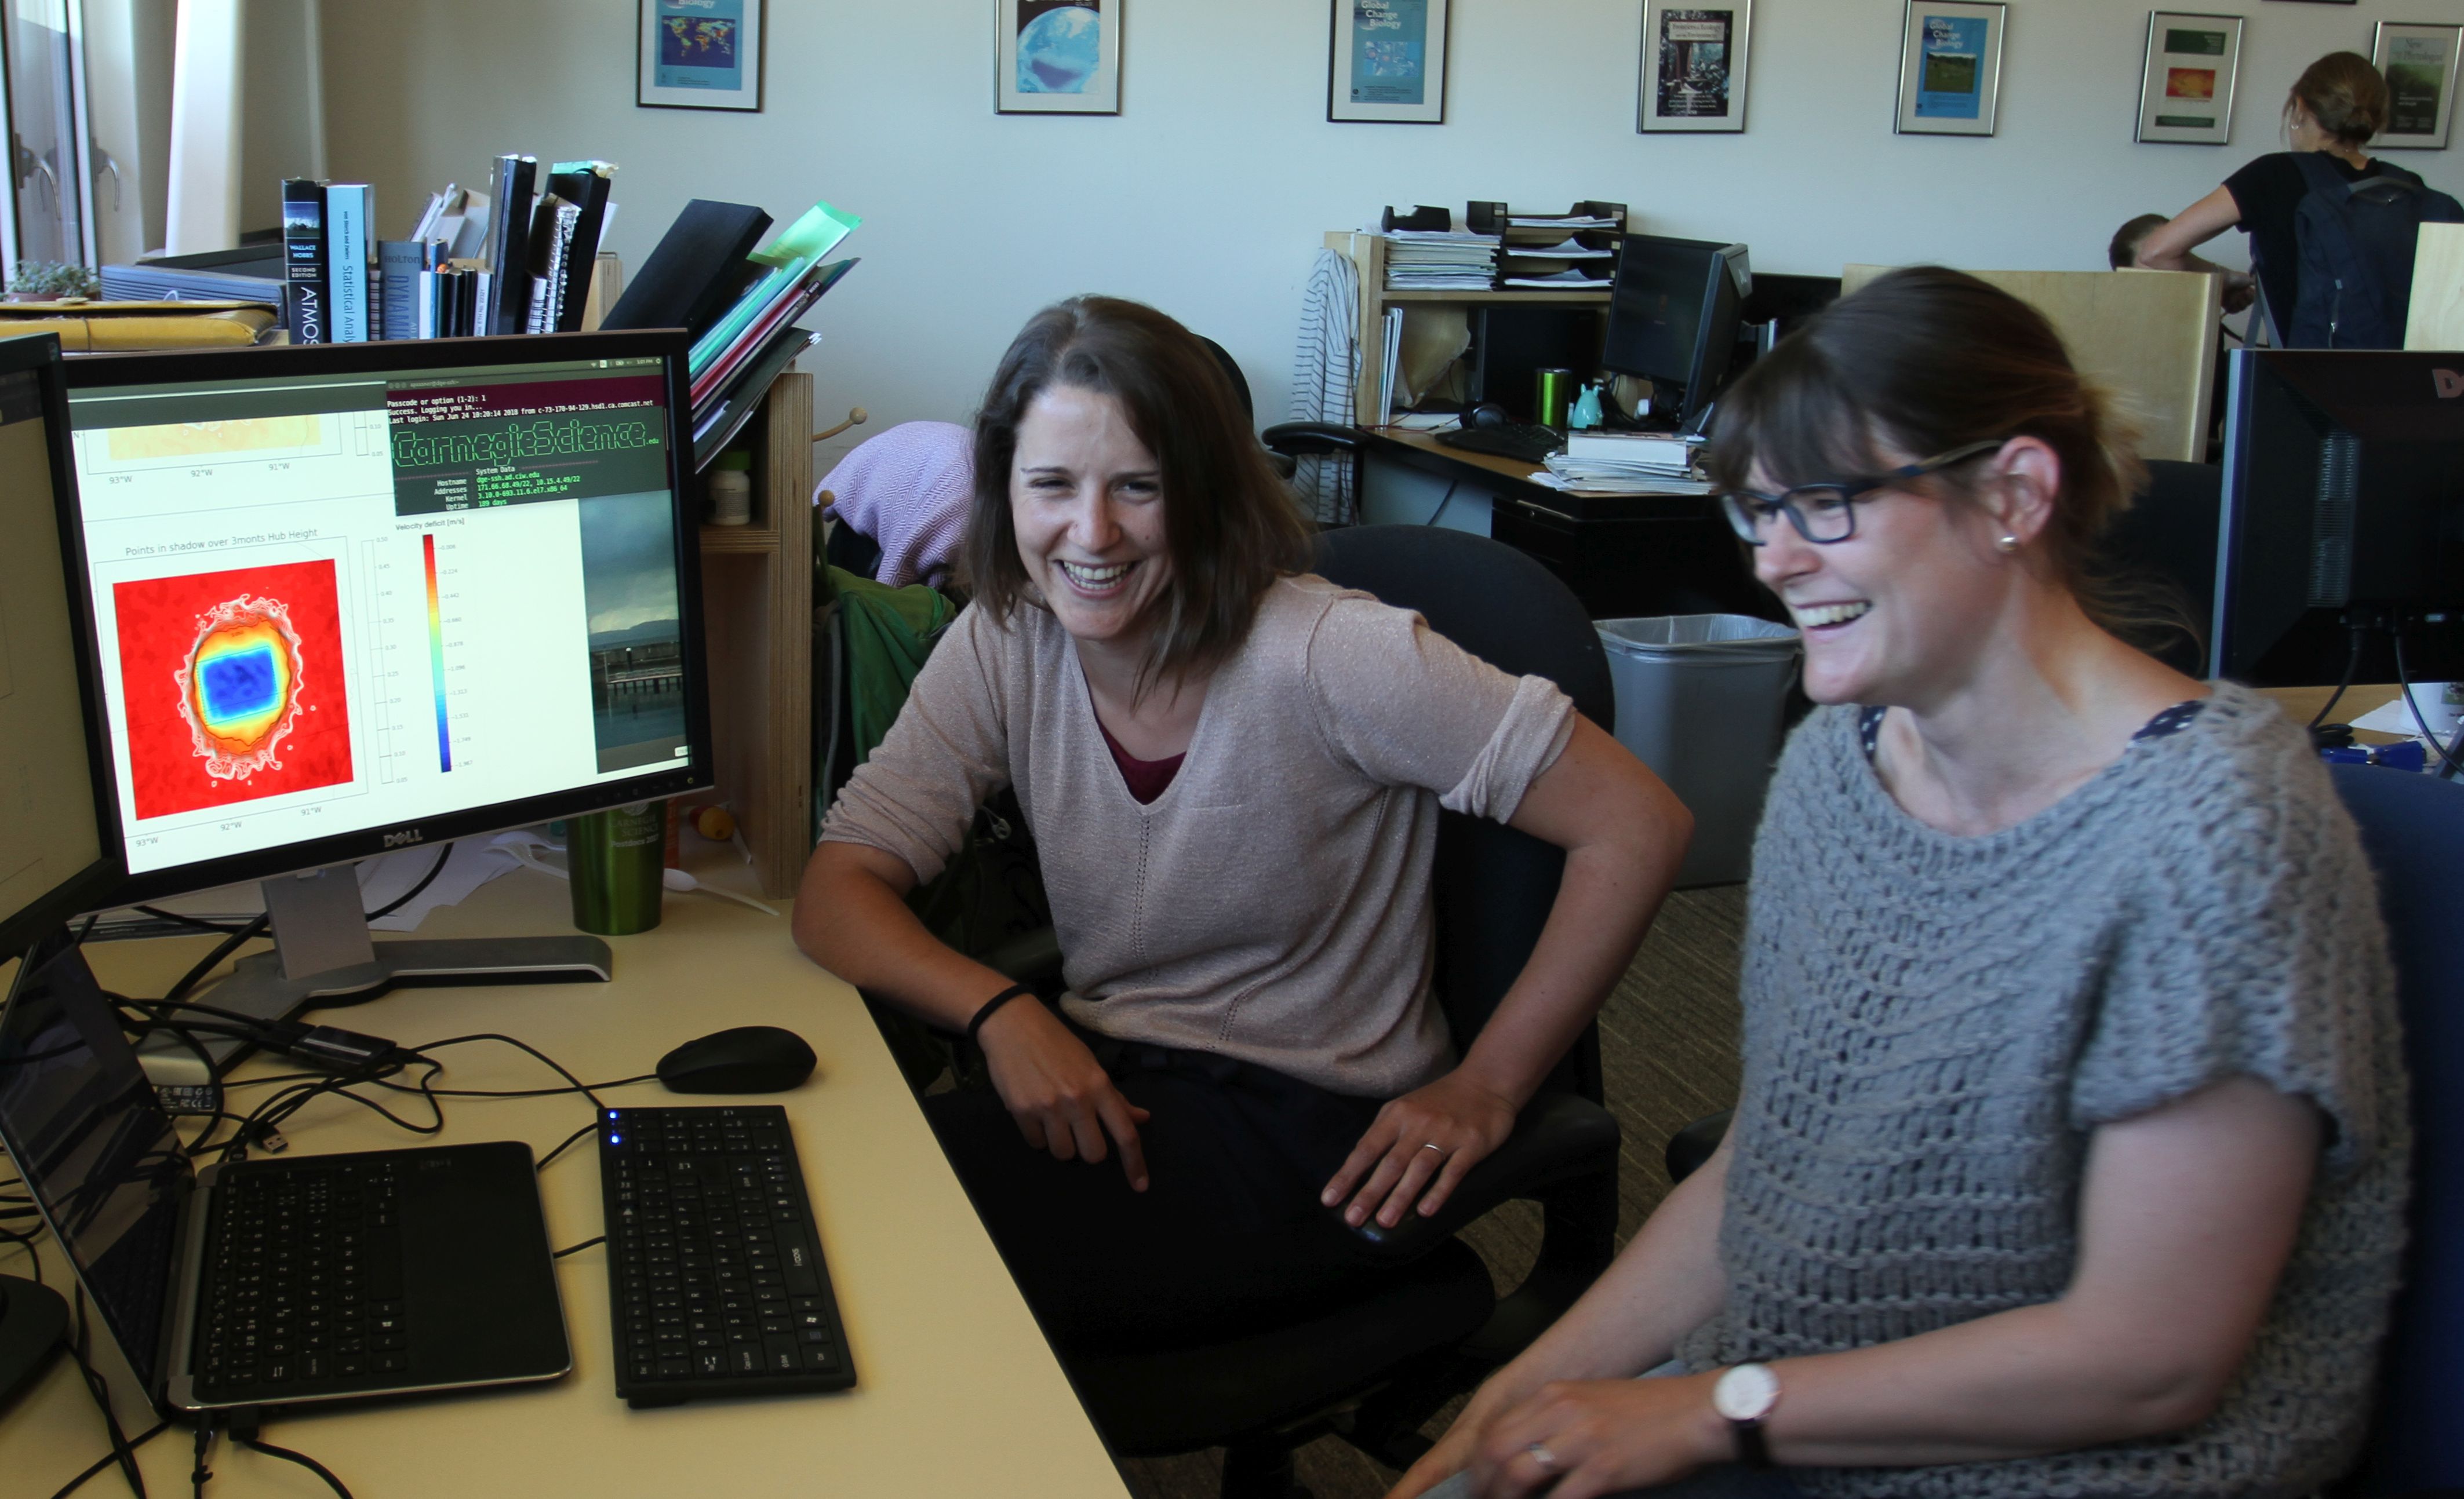
Carnegie postdocs Clara Garcia-Sanchez and Anna Possner using fluid dynamical models to investigate geophysical limits to wind power.
Most people in the world are focused on solving pressing problems (how to provide for their families, how to get access to health care, etc). Most people are faced with pressing problems that they have to solve, not problems they choose to solve.
Some people approach their scientific or technical work choosing to focus on pressing problems (“What can I be doing to most effectively help a transition to a clean energy system?”) but other people approach their work thinking, “I have a hammer; are there any nails around that I might be able to hammer on?” — Or even worse, “Are there any nails around that other people have already whacked at, but that I might be able to give another whack or two?”
If you are not working on a problem that you feel is important and pressing, then you are probably working on the wrong problem. (The reason the problem is important could be for fundamental scientific understanding, and not necessarily utilitarian concern.)
It is important to start with the problem, not the tool.
Once you have identified the problem, then your experience with specific tools might inform how you can most effectively contribute to problem solution, but the starting point should be the problem, not the tool.
An intermediate position is to ask: What are the important problems that this tool could contribute to solving? Realistically, this is where we are with much of our work.
The main point is: If you are having trouble finding important problems to address with the tools you already know how to use, that is probably a sign that it is time to learn to use new tools. (This is why I have been learning about economics and energy system modeling.)
You should not just address ever more arcane and irrelevant problems using the tools you already know how to use.
In short:
The world is replete with pressing problems. If you are not working on at least one of these problems, there is a good chance you are wasting your time and you should be doing something else.
If you have recently gotten your PhD or will get your PhD within the next year or two, and are interested in trying to address important problems using new tools or approaches, please apply for a postdoc job in my group.
I woke up this morning to read The Federalist quoting me out of context, putting words in my mouth that I did say but wished I had worded more carefully. For those not familiar with The Federalist, they are a right wing online magazine.
“This opens up the possibility that we could stabilize the climate for affordable amounts of money without changing the entire energy system or changing everyone’s behavior,” Ken Caldeira, a senior scientist at the Carnegie Institution for Science, told The Atlantic.
Here is the full email I sent to Robinson Meyer, writer for The Atlantic:
Rob,
I am no expert in systems costing, but I read the paper as saying that Direct Air Capture of carbon dioxide would cost somewhere in the range of $100 to $250 per ton.
If these costs are real, it is an important result.
If you look at this paper (and this is what I could find quickly on the web)
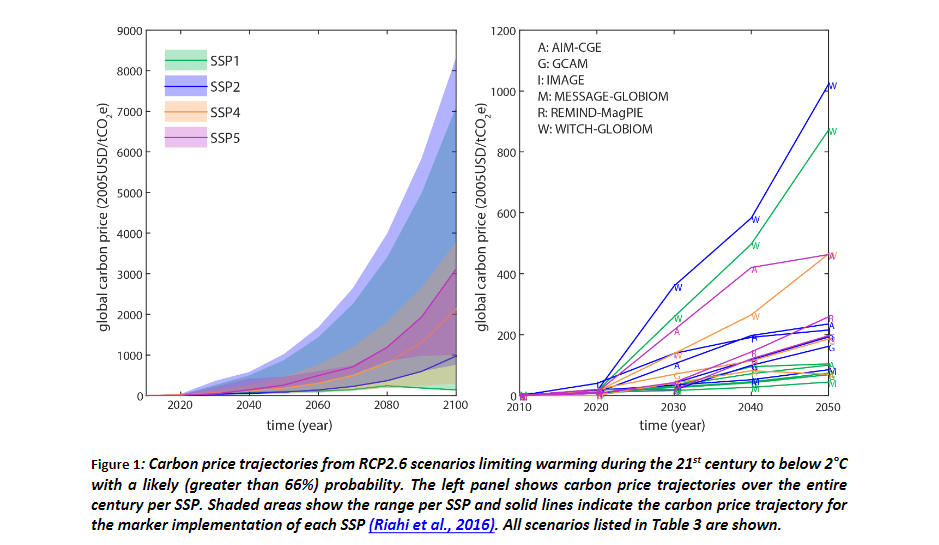
Carbon prices projected for this century look like this for 2 C stabilization from a business-as-usual scenario:
If you notice, by the end of the century, these integrated assessment models project carbon prices of many hundreds if not thousands of dollars per ton CO2.
The IPCC estimated that these levels of carbon prices could shave 5% off of global GDP.
The result of David Keith and colleagues suggest that carbon prices could never go above the $100 to $250 range per ton CO2, because it would be economic to capture CO2 from air at that price.
This suggests that the hardest to decarbonize parts of the economy (e.g., steel, cement manufacture, long-distance air travel, etc) might continue just as they are now, and we just pay for CO2 removal.
To put these prices in context, $100 per ton CO2 works out to about $1 per gallon of gasoline. This suggests that a fee of somewhere between $1 and $2.50 per gallon would allow people to drive their ordinary cars, and we could just suck the CO2 out of the atmosphere later.
This opens up the possibility that we could stabilize climate for affordable amounts of money without changing the entire energy system or changing everyone’s behavior.
To give more context, global CO2 emissions is something like 36 GtCO2 per year. If we were to remove all of that with air capture at $100 per tonCO2, that works out to $3.6 trillion dollars.
Depending on how you count things, global GDP is somewhere in the neighborhood of $75 to $110 trillion. So, to remove all of this CO2 would be something like 3 to 5% of global GDP (if the $100 per ton number is right). This puts an upper bound on how expensive it could be to solve the climate problem, because there are lots of ways to reduce emissions for less than $100 per ton.
In any case, it makes it much easier to deal with the hardest to decarbonize parts of the economy.
Again, this is all with the caveat that I am no expert in costing of engineering systems. But, if this paper is correct, the result seems important to me.
It is always going to be easier and cheaper to avoid making a mess than to clean up one we have already made. It is easier to remove carbon dioxide from a smokestack, where the exhaust is 10 percent carbon dioxide, than from the atmosphere, which is 0.04 percent carbon dioxide.
When the Constitution of the United States of America was written, it seemed inconceivable that people would be released from slavery or that women would vote. Just a few years before gay marriage became the law of the land, it would have been impossible to predict such a sweeping change in social attitudes. For us to even have a chance of addressing the climate problem, we’ll need another huge change in public attitudes. It will need to be simply unacceptable to build things with smokestacks or tailpipes that dump waste into the air. This change could happen.
The point with my poorly worded quote was not that we don’t need revolutionary changes in our energy system, but that there are some very hard-to-deal-with sources of CO2 emission, like long-distance aviation, that could be addressed by using hydrocarbon fuels coupled with contemporaneous capture of CO2 by devices like that being investigated by David Keith and colleagues.
As recently as 1 June 2018, I wrote an email to Peter Frumhoff of the Union of Concerned Scientists, urging that organization to put out a statement saying:
Today’s emissions policies should be based on the assumption that most [of] our CO2 emissions will remain in the environment for hundreds of thousands of years. Emissions policies should not be made on the assumption that future generations will clean up our mess using carbon dioxide removal technologies and approaches.
There is a big difference in using direct air capture of CO2 to offset contemporaneous emissions and using direct air capture of CO2 to argue that we can continue emitting CO2 today in the hopes that someone else will clean up our mess in the future.
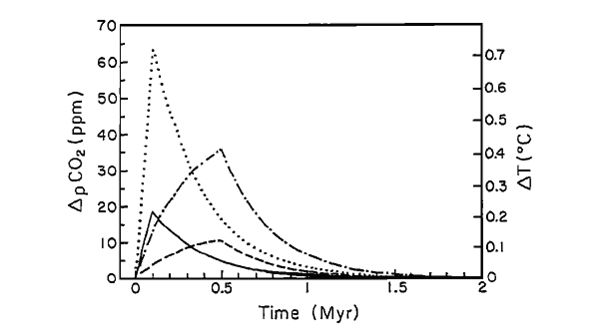
As a little egomaniacal side note, I would like to point out that Caldeira and Rampino (1990) may be the first paper to point out the approximately 300,000 year time scale for removal of atmospheric CO2 concentration perturbations by silicate rock weathering. This estimate has held up pretty well over the last decades.
What are the lessons learned?
When speaking or writing an email to a journalist, think about how each sentence can be read taken out of context. Even if you trust the journalist to represent your views well (and I think Robinson Meyer did an excellent job), somebody later can take a carelessly worded statement and use it out of context.
Also, we are busy, and when requests come in, we often try to respond with something quickly so we can get back to our day jobs (which in my case happens to be scientific and technical research). I should slow down a little bit and take the time needed to write more careful prose.
So, what do you do when a poorly expressed idea is quoted out of context by people with a political agenda?
My answer: “Write a blog post about it, and then Tweet and move on.”
My postdocs and I are having a discussion about how to be more efficient in producing high-impact papers in quality peer-reviewed journals. I sent the steps in my preferred process to them, which are repeated below.
Photo by Jess Barker
Steps are similar for the observationally-based work we do. The main difference is that obtaining additional observations is usually much harder than performing additional model simulations.
Steps to writing a scientific paper
1. Play until you stumble on something of interest. Obtain initially promising results. Alternatively, think about what paper people would find useful that you could write but has not yet been written.
2. Write a provisional draft abstract for the proposed paper. This defines the problem, the scope of work, the expected results, and why it is important or interesting. What is the main point of the study and why should anyone care? This is a good time to start thinking about the target journal.
3. Write the introduction of the proposed paper. This forces you to do a literature review and understand what else is out there. It also forces you to write up the problem statement while you still think the problem is important. Usually, by the end of the study, the result seems trivial and obvious, and the problem unimportant.
4. Do additional simulations, measurements, analyses, etc, needed to test out the basic hypothesis and produce data for tables and figures. Attempt to get enough of a mechanistic understanding so that the central result starts to seem trivial and obvious.
5. Create rough drafts of figures. Make an abundance of figures, assuming that some will be in the main paper, some in the supporting material, some for talks, and some not used at all. Make preliminary decision of what figures will be in the main paper.
6. Write first draft of paper around figures. Do this before iterating on figure improvement. The standard outline is: Abstract, Introduction, Methods, Results, Discussion, Conclusions. The Results section should describe the results produced by the model. Usually, the Discussion section should discuss the relevance of those model results to the real world. Sometimes, the exposition is smoother if results in a sequence are each in turn presented and then discussed. This is OK if care is taken to be clear about when you are referring the model and when you are referring to the real world.
7. Write figure captions. Figure captions are often among the parts of the paper read by the broadest audience. Place in figure caption a one sentence statement of the main point you expect the reader to derive from looking at the figure. Sometimes editors pull this sentence out, but they often leave it in. In any case, you should understand the main point of each figure.
8. Iterate improvement of the draft of the paper and main paper figures until the process starts to asymptote. Do additional simulations and make additional figures as necessary. Take care to make your figures beautiful. Beautiful figures not only communicate scientific content well to a broad audience, but also communicate that you care about your work and strive for a high level of excellence. Consider target journal guidelines and what should go in the supporting material and what should be in the main body of the paper.
9.Wherever possible, replace jargon and acronyms with ordinary English. Insofar as it is possible, improve felicity of expression. Write good prose. This is especially important in the abstract, first and last paragraphs, and figure captions.
10. Before submission, double check that the main story of the paper can be obtained by reading (1) the abstract, (2) the first paragraph, (3) the last paragraph, and (4) the figure captions. This is already more than what most ‘readers’ of your paper will actually read. Only experts will read the entire paper. Most readers will just want the idea of the paper and the basic results.
11. Make sure all codes, intermediate data, etc, are packaged up in a single directory. This is done both to facilitate making modifications later, and also so as to provide maximum transparency into and reproducibility of the scientific process.
12. Write cover letter to editor and submit. Stress the new finding and to whom this finding will be of interest. Suggest knowledgeable reviewers who you have not collaborated with recently. If you have written papers on related topics, people who have cited your previous papers would be good candidate reviewers.
Key is to have rough figures and a rough draft on paper early. It is much easier to improve existing text and figures than to start with a blank page.
Also key is recognizing when your manuscript is beginning to asymptote. A sloppy error-filled manuscript will give reviewers the feeling that your work is sloppy. However, perfectionism can mean low productivity. Striking the correct balance is hard.
Another thing is to do Step One 20 times. If you have 20 ideas for papers you can pick the best one. If you have only one idea, it is unlikely to be a great idea. People who have only one idea at a time tend to write papers that are footnotes to their previous papers, and then have careers that descend into meaningless detail that nobody cares about.
You might also want to take a look at this advice on writing scientific papers from George M. Whitesides, and this advice on the 5 most pivotal paragraphs in a scientific paper by Brian McGill.
Environmental science of climate, carbon, and energy