If energy storage is abundant, then that storage can fill the gap between intermittent electricity generation (wind and solar) and variable electricity demand. Jacobson et al. (PNAS, 2015) filled this gap, in part, by assuming that huge amounts of hydropower would be available.
The realism of these energy storage assumption was questioned by Clack et al. (PNAS, 2017), but Clack et al. (PNAS, 2017) went further and asserted that Jacobson et al. (PNAS, 2015) contained modeling errors. A key issue centers on the capacity of hydroelectric plants. The huge amount of hydro capacity used by Jacobson et al. (PNAS, 2015) is necessary to achieve their result, yet seems inconsistent with the information provided in their tables.
Clack et al. (PNAS, 2017) in their Fig. 1, reproduced Fig. 4b from Jacobson et al. (2015), over a caption containing the following text:

This figure (figure 4B from ref. 11) shows hydropower supply rates peaking at nearly 1,300 GW, despite the fact that the proposal calls for less than 150 GW hydropower capacity. This discrepancy indicates a major error in their analysis.
(A dispatch of 1 TWh/hr is equivalent to dispatch at the rate of 1000 GW.)
Since the publication of Clack et al. (PNAS, 2017), Jacobson has asserted the apparent inconsistency between what is shown in Fig. 4b of Jacobson et al. (PNAS, 2015) and the numbers appearing in their text and tables was in fact intentional, and thus no error was made. Mark Z. Jacobson went so far as to claim that the statement that there was a major error in the analysis constituted an act of defamation that should be adjudicated in a court of law.
The litigious activities of Mark Z. Jacobson (hereafter, MZJ) have made people wary of openly criticizing his work.
I was sent a Powerpoint presentation looking into the claims of Jacobson et al. (PNAS, 2015) with respect to this hydropower question, but the sender was fearful of retribution should this be published with full attribution. I said I would take the work and edit it to my liking and publish it here as a blog post, if the primary author would agree. The primary author wishes to remain anonymous.
I would like to stress here that this hydro question is not a nit-picking side-point. In the Jacobson et al. (PNAS, 2015) work, they needed the huge amount of dispatchable power represented by this dramatic expansion of hydro capacity to fill the gap between intermittent renewable electricity generation and variable electricity demand.
In the text below, Jacobson et al. (E&ES, 2015) refers to:
Jacobson MZ, et al. (2015) 100% clean and renewable wind, water, and sunlight (WWS) all-sector energy roadmaps for the 50 United States. Energy Environ Sci 8:2093–2117.
Jacobson et al (PNAS, 2015) refers to:
Jacobson MZ, Delucchi MA, Cameron MA, Frew BA (2015) Low-cost solution to the grid reliability problem with 100% penetration of intermittent wind, water, and solar for all purposes. Proc Natl Acad Sci USA 112:15060–15065.
and Clack et al (PNAS, 2017) refers to:
Clack, C.T. M, Qvist, S. A., Apt, J., Bazilian, M., Brandt, A. R., Caldeira, K., Davis, S. J., Diakov, V., Handschy, M. A., Hines, P. D. H., Jaramillo, P., Kammen, D. M., Long, J. C. S., Morgan, M. G., Reed, A., Sivaram, V., Sweeney, J., Tynan, G. R., Victor, D. G., Weyant, J. P., Whitacre, J. F. Evaluation of a proposal for reliable low-cost grid power with 100% wind, water, and solar. Proc Natl Acad Sci USA DOI: 10.1073/pnas.1610381114.
Jacobson et al. (E&ES, 2015) serves as the primary basis of the capacity numbers in Jacobson et al. (PNAS, 2015)
May 25, 2015: Mark Z. Jacobson et al. publish paper in Energy & Environmental Science (hereafter E&ES), providing a “roadmap” for the United States to achieve 100% of energy supply from “wind, water, and sunlight (WWS).”
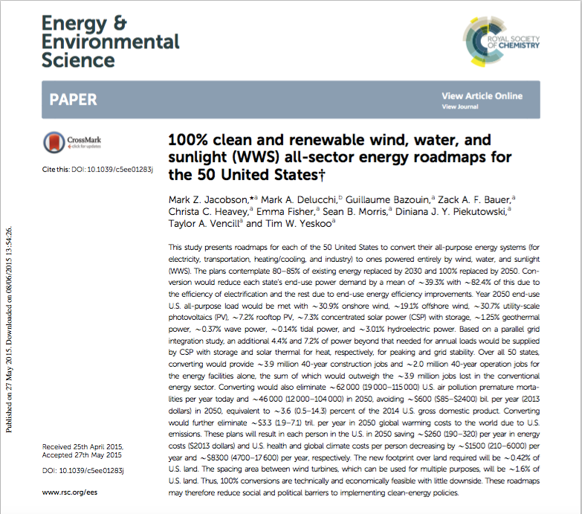
To demonstrate that the roadmaps in Jacobson et al. paper (E&ES, 2015) can reliably match energy supply and demand at all times, that study cites forthcoming study (Ref. 2) that uses “grid integration model” .

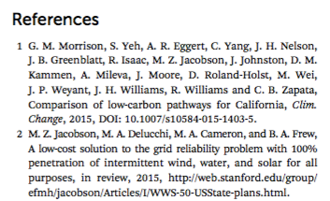
Ref. 2 is the at-that-point-forthcoming PNAS paper, “A low-cost solution to the grid reliability problem with 100% penetration of intermittent wind, water, and solar for all purposes” “in review” at PNAS.
This establishes the link between the two papers:
(1) The E&ES paper provides the “roadmap” describing the mix of renewable energy resources needed to supply the US;
(2) The PNAS paper then attempts to demonstrate the operational reliability of this mix of resources.
Jacobson et al. (E&ES, 2015) makes it clear that ‘capacity’ refers to ‘name-plate capacity’
Table 2 of the E&ES paper explicitly describes the “rated power” and “name-plate capacity” of all renewable energy and energy storage devices installed in the 100% WWS roadmap for the United States. Both of these terms refer to the maximum instantaneous power that a power plant can produce at any given moment. These are not descriptions of average output, and nowhere in the table’s lengthy description does Jacobson et al. (E&ES, 2015) claim that hydroelectric power is described differently in this table than the other resources.
The table states that the total nameplate capacity or maximum rated power output of hydroelectric generators in Jacobson et al. (E&ES, 2015) is 91,650 megawatts (MW). In addition, column 5 states that 95.87% of this final installed capacity is already installed in 2013. Only 3 additional new hydroelectric plants at a size of 1,300 MW each, for a total addition of 3,900 MW over existing hydroelectric capacity are included in Jacobson et al. (E&ES, 2015) .
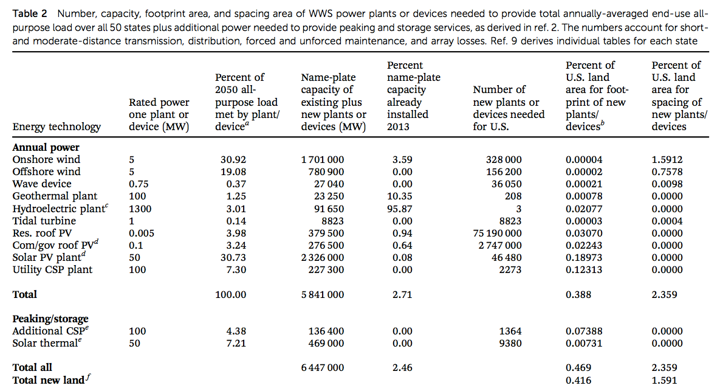

Jacobson et al. (E&ES, 2015) describes hydro capacity assumptions in some detail
Section 5.4 of the E&ES paper provides additional textual description of the WWS roadmap’s assumptions regarding hydroelectric capacity.
The text states that the total existing hydroelectric power capacity assumed in the WWS roadmap is 87.86 gigawatts (GW; note 1 GW = 1,000 MW).
It further states that only three new dams in Alaska with a total capacity of 3.8 GW are included in the final hydroelectric capacity in the WWS roadmap.
Note that throughout this text, Jacobson et al. (E&ES, 2015) distinguish between “delivered power,” a measure of average annual power generation, and “total capacity,” a measure of maximum instantaneous power production capability. It is this later “total capacity” figure that matches the “nameplate capacity” in Table 2 of 87.86 GW in the 100% WWS Roadmap for 2050.
The text explicitly states that the average delivered power from hydroelectric generators is 47.84 GW on average in 2050.
In Jacobson et al. (E&ES, 2015), the authors state both the maximum power production capability from hydroelectric power assumed in the WWS roadmap and distinguish this from the separately reported average delivered power from these facilities over the course of a year.


Most of the capacity numbers appearing in Jacobson et al. (2015) come from the US Energy Administration. They define what is meant by capacity as represented by their numbers:
Generator nameplate capacity (installed): The maximum rated output of a generator, prime mover, or other electric power production equipment under specific conditions designated by the manufacturer. Installed generator nameplate capacity is commonly expressed in megawatts (MW) and is usually indicated on a nameplate physically attached to the generator.
Generator capacity: The maximum output, commonly expressed in megawatts (MW), that generating equipment can supply to system load, adjusted for ambient conditions.
The remainder of Section 5.4. discusses several possible ways in which additional hydroelectric power capacity could be added in the United States without additional environmental impact, if it is not possible to increase the average power production from existing hydroelectric dams as Jacobson et al. (E&ES, 2015) assume is possible.
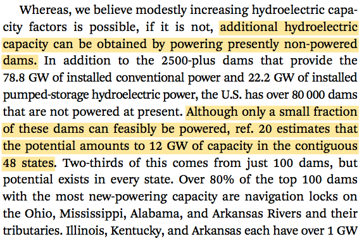
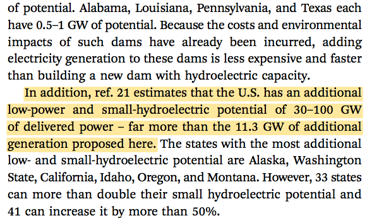
This text describes the potential to add power generation turbines to existing unpowered dams and cites a reference estimating a maximum of 12 GW of additional such capacity possible in the continguous 48 states.
The text also describes the potential for new low-power and small hydroelectric dams, citing a reference that estimates that 30-100 GW of average delivered power—or roughly 60-200 GW of total maximum power capacity at Jacobson et al.‘s (E&ES, 2015) assumed average production of 52.5% of maximum power for each hydroelectric generator.
Nowhere in this lengthy discussion of the total hydroelectric capacity assumed in the WWS roadmap and additional possible sources of hydroelectric capacity does Jacobson et al. (E&ES, 2015) mention the possibility of adding over 1,000 GW of additional generating capacity to existing dams by adding new turbines.
The May 2015 E&ES paper by MZJ et al. explicitly states that the maximum possible instantaneous power production capacity of hydroelectric generators in the 100% WWS roadmap for the 50 U.S. states is 91.65 GW.
Jacobson et al. (E&ES, 2015) also explicitly distinguishes maximum power capacity from average delivered power in several instances. The later is reported as 47.84 GW on average in 2050 for the 50 U.S. states.
Additionally, the authors explicitly state that 3.8 GW of the total hydro capacity in the 50 state WWS roadmap comes from new dams in Alaska. This is in addition to 0.438 GW of existing hydro capacity in Alaska and Hawaii as reported in the paper’s Fig. 4. This is important to note, because Alaska and Hawaii are excluded from the simulations in Jacobson et al. (PNAS, 2015).
The E&ES companion paper to the Jacobson et al. (PNAS, 2015) therefore explicitly establishes that the maximum possible power capacity that could be included in the PNAS paper in the contiguous 48 U.S. states is 87.412 GW (e.g. 91.65 GW in the 100% WWS roadmap for the 50 US states, less 3.8 GW of new hydropower dams in Alaska and 0.438 GW of existing hydro capacity in Alaska & Hawaii).
Summary of key relevant facts about Jacobson et al. (E&ES, 2015)
In summary, the May 2015 Jacobson et al. (E&ES, 2015) paper establishes several facts:
- The E&ES paper explicitly states that the maximum possible instantaneous power production capacity of hydroelectric generators in the 100% WWS roadmap for the 50 U.S. states is 91.65 GW (inclusive of imported hydroelectric power from Canada).
- The E&ES paper also explicitly distinguishes maximum power capacity from average delivered power. The later is reported as 47.84 GW on average in 2050 for the 50 U.S. states.
- The E&ES paper explicitly states that 3.8 GW of the total hydropower capacity in the 50 state WWS roadmap comes from new dams in Alaska and reports that existing capacity in Alaska and Hawaii totals 0.438 GW. This is relevant, because Alaska and Hawaii are excluded from the simulations in the Jacobson et al. (PNAS, 2015) which focuses on the contiguous 48 U.S. states.
- The E&ES companion paper to Jacobson et al. (PNAS, 2015) therefore explicitly establishes that the maximum possible power capacity that could be included in the PNAS paper in the contiguous 48 U.S. states is no more than 87.412 GW.
- No where in Jacobson et al. (E&ES, 2015) do the authors discuss or contemplate adding more than 1,000 GW of generating capacity to existing hydropower facilities by adding new turbines and penstocks. In contrast, the paper explicitly discusses several other possible ways to add a much more modest capacity of no more than 200 GW of generating capacity by constructing new low-power and small hydroelectric dams.
- Jacobson et al. (E&ES, 2015) establishes that Jacobson et al. (PNAS, 2015) is a companion to this E&ES paper and that the purpose of the PNAS paper is to confirm that the total installed capacity of renewable energy generators and energy storage devices described in the 100% WWS roadmap contained in the E&ES paper can reliably match total energy production and total energy demand at all times. The total installed capacities for each resource, including hydroelectric generation, described in the E&ES paper, therefore form the basis for the assumed maximum generating capacities in the PNAS paper.
Jacobson et al. (PNAS, 2015) relies on hydro capacity numbers from Jacobson et al. (E&ES, 2015)
December 8, 2015: The paper “Low-cost solution to the grid reliability problem with 100% penetration of intermittent wind, water, and solar for all purposes” by Jacobson et al. (PNAS, 2015) is published in PNAS as the companion to the May 2015 Jacobson et al. (E&ES, 2015) paper.
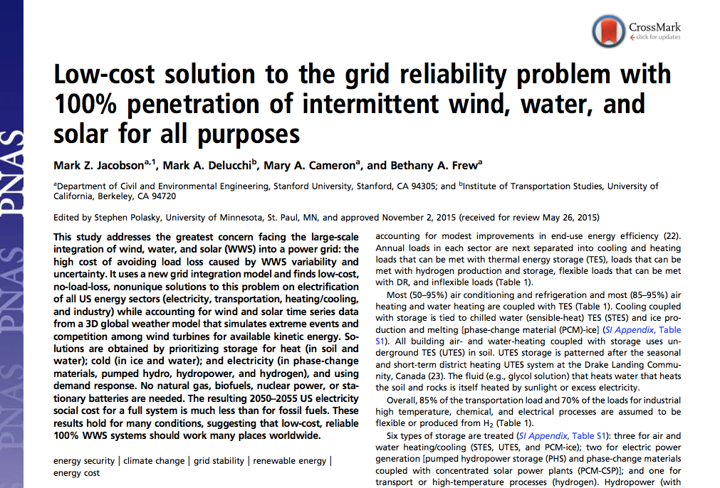

Jacobson et al. (PNAS, 2015) describes existing (year-2010) hydro capacity to be 87.86 GW.

The text further establishes that the installed capacities for each generator type for the continental United States (abbreviated “CONUS” in the text) are based on ref. 22, which is Jacobson et al. (E&ES, 2015).
![]()
“Installed capacity” is a term of art referring to maximum possible power production, not average generation. The paper’s description of “Materials and Methods” states the the “installed capacities” of each renewable generator type are described in the Supplemental Information Table S2 of Jacobson et al. (PNAS, 2015).
Table S2 of the Supplemental Information for the PNAS paper explicitly states the “installed capacity” or maximum possible power generation of each resource type in the Continental United States used in the study.
The explanatory text for this paper again establishes that all installed capacities for all resources except solar thermal and concentrating solar power (abbreviated “CSP” in the text) are taken from Jacobson et al. (E&ES, 2015), adjusted to exclude Hawaii and Alaska. Jacobson et al. (E&ES, 2015) is ref. 4 in the Supplemental Information for Jacobson et al. (PNAS, 2015).
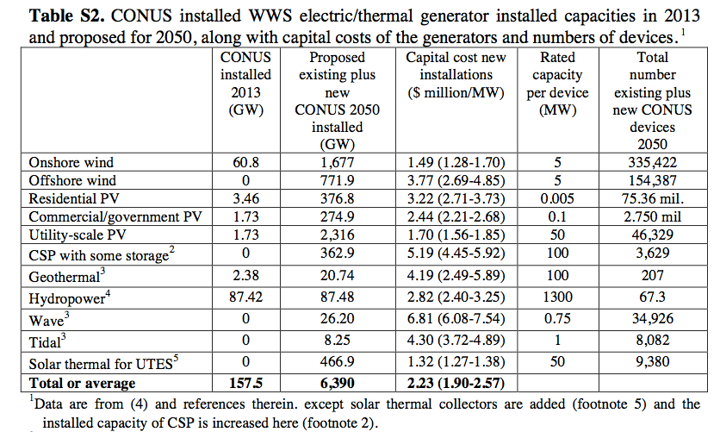
Reference 4 (E&ES, 2015).
![]()
Total installed hydroelectric capacity in Table S2 of Jacobson et al. (PNAS, 2015) is stated as 87.48 GW. This is close to the 87.412 GW of total nameplate power capacity of hydroelectric generators in the 50 U.S. states roadmap, less the new hydro dams in Alaska and existing hydropower capacity in Alaska and Hawaii.
Footnote 4 notes that hydro is limited by ‘annual power supply’ but does not mention that instantaneous generation of electricity is also limited by hydro capacity:
![]()
Additionally, columns 5 & 6 of Table S2 separately state the “rated capacity” per device and the total number of existing and new devices in 2050 for each resource.
“Rated capacity” is a term of art referring to the maximum possible instantaneous power production for a power plant.
The rated capacity for each hydroelectric device or facility is stated as 1,300 MW and the total number of hydroelectric devices is stated as 67.3. This yields exactly 87,480 MW or 87.48 GW, the installed capacity reported for hydroelectric power in column 3. This provides further corroboration that the 87.48 GW of installed capacity reported refers to maximum rated power generation capabilities of all hydroelectric generators in the simulation, not their average generating capacity as MZJ asserts.
Nowhere in this table, its explanatory text in the Supplemental Information, or the main text of the PNAS paper do the authors establish that they assume more than 1,000 GW of additional hydroelectric generating turbines to existing hydroelectric facilities, as MZJ will later assert.
In contrast, the table establishes that the authors assume that total installed hydroelectric capacity in the Continential United States is assumed to increase from 87.42 GW in 2013 to 87.48 GW in 2050, or an increase of only 0.06 GW or 60 MW.
The hydro power capacity represented in the Jacobson et al. (PNAS, 2015) tables is inconsistent with the amount of hydro capacity used in their simulations
Despite explicitly stating that the maximum rated capacity for all hydropower generators in the PNAS paper’s WWS system for the 48 continental United States is 87.48 GW, Fig. 4 of Jacobson et al. (PNAS, 2015) shows hydropower facilities generating more than 1,000 GW of power output sustained over several hours on the depicted days.
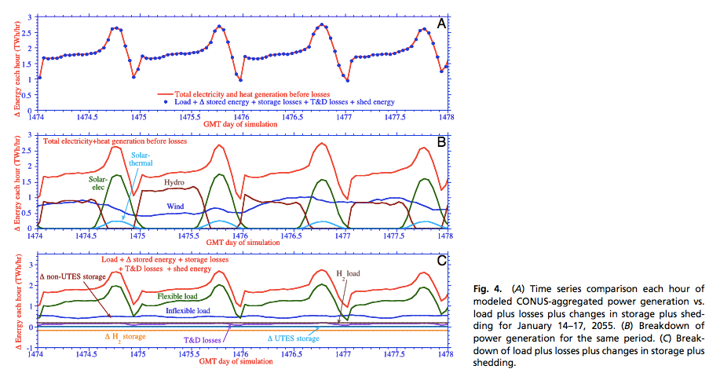
Examination of the detailed LOADMATCH simulation results (available from MZJ upon request) reveals that the maximum instantaneous power generation from hydropower facilities in the simulations performed for Jacobson et al. (PNAS, 2015) is 1,348 GW, or 1,260.5 GW more (about 15 times more) than the maximum rated capacity reported in Table S2.
It is therefore clear that the LOADMATCH model does not constrain maximum generation from hydropower facilities to the 87.48 GW of maximum rated power capacity stated in Table S2.
(Note that hydropower facilities also dispatch at 0 GW for many hours of the simulation. It therefore appears that the LOADMATCH model neither applies a maximum generation constraint of 87.48 GW or any kind of plausible minimum generation constraint for hydropower facilities.)
Summary of key facts related to hydro capacity in Jacobson et al. (PNAS, 2015)
In summary, the December 8, 2015 PNAS paper establishes the following facts:
- The installed capacity used in the simulations in Jacobson et al. (PNAS, 2015) is reported in Table S2 of the Supplemental Information for that paper. The total installed hydroelectric capacity or maximum possible power generation reported in Table S2 is stated as 87.48 GW.
- This maximum capacity figure is also separately corroborated by taking the rated power generating capacity per device and total number of devices reported in Table S2, which also yields a maximum rated power production from all hydroelectric generators of 87.48 GW.
- Table S2 states the the authors only assume 0.06 GW of additional hydroelectric power capacity is added between 2013 and 2050.
- Nowhere in the text of Jacobson et al. (PNAS, 2015), its Supplemental Information document, or the explanatory text for Table S2 do the authors state that the term “installed capacity” or “rated capacity per device” for each resource reported in the table is used in any other way than the standard terms of art indicating maximum power generation capability. Nor do the authors establish that total installed capacity of hydroelectric generation is described differently in this table than the other resources and refers instead to average annual delivered power as MZJ claims.
- Jacobson et al. (PNAS, 2015) also references and uses Jacobson et al. (E&ES, 2015) to establish the installed power generating capacity of each resource in the simulations performed in the PNAS paper, with the explicit exception of solar thermal and concentrating solar power. The maximum rated power from hydroelectric generation reported in Table S2 of 87.48 GW is consistent (within 68 MW) with the 87.412 GW of name-plate generating capacity reported in the E&ES paper for the 50 U.S. states less three new hydropower dams in Alaska and existing hydro capacity in Alaska and Hawaii reported in the E&ES paper.Recall also that the average delivered power from hydroelectric generators was explicitly and separately stated in the E&ES paper as 47.84 GW for the 50 U.S. states, and is therefore no more than 47 GW for the 48 Continential US states. The reported “installed capacities” for hydroelectric generation in PNAS Table S2 is therefore entirely consistent with the “name-plate capacity” reported in the E&ES paper and is not consistent with the average delivered power from hydroelectric generation reported in the E&ES paper.
- Despite establishing a maximum rated power capacity of 87.48 GW, the simulations performed for Jacobson et al. (PNAS, 2015) dispatch hydropower at as much as 1,348 GW, or 1,260.5 GW more than the maximum rated capacity reported in Table S2.
Conclusions
Given available information in the published papers, a reasonable reader should interpret the “installed capacity” or “rated capacity” figures explicitly reported in Table S2 of the Jacobson et al. (2015) paper as referring to maximum generating capacity, because that is the definition used by the studies reported on in the table.
This assertion that the 1,348 GW of maximum hydro generation used in the LOADMATCH simulations for the PNAS paper constitutes an intentional but entirely unstated assumption rather than a modeling error (e.g. a failure to impose a suitable capacity constraint on maximum hydro generation in each time period) is, as we understand it, the primary basis for MZJ’s lawsuit alleging that Christopher Clack and the National Academies of Sciences (publishers of PNAS) intentionally misrepresented his work and thus defamed his person.
A reading of the E&ES and PNAS papers establishes that the MZJ et al. did not omit explicit description of the total rated power capacity of hydroelectric facilities. In point of fact, the authors establish in multiple ways that the maximum power capacity for hydroelectric facilities in the PNAS WWS study for the 48 continental United States is 87.48 GW, not the 1,348 GW actually dispatched by the LOADMATCH model.
Thus, information in the E&ES and PNAS papers do not appear to be consistent with MZJ’s assertions that he and his coauthors had intentionally meant to add more than 1,000 GW of generating capacity to existing hydropower facilities in their model. (It is outside the scope of this analysis to discuss the plausibility of adding more than 1,000 GW of hydro capacity to existing dams.) Nor does the available evidence indicate that they intentionally assumed more than 1,000 GW of additional hydro capacity and then simply failed to disclose this assumption at any point in either of the two papers. Such failure to explicitly describe such a large and substantively important assumption to readers and peer reviewers might itself constitute a breach of academic standards.
The operation of the LOADMATCH model is inconsistent with the maximum power generating capacity of hydropower facilities explicitly stated in Jacobson et al. (PNAS, 2015) and in the companion paper, Jacobson et al. (E&ES, 2015) upon which the generating capacities are based. Whether you call failure to impose a suitable capacity constraint on maximum hydro generation in each time period a “modeling error” is up to you, but that would seem to be an entirely reasonable interpretation based on the available facts.
