How much ice is melted by each carbon dioxide emission?

I am refining and extending  a back-of-envelope calculation here that I did for an interesting discussion on the Carbon Dioxide Removal google group about Marzeion et al. (2018), which concluded that mountain glaciers contribute about 15 kg of ice melt for each kg of CO2 released.  

F2.large

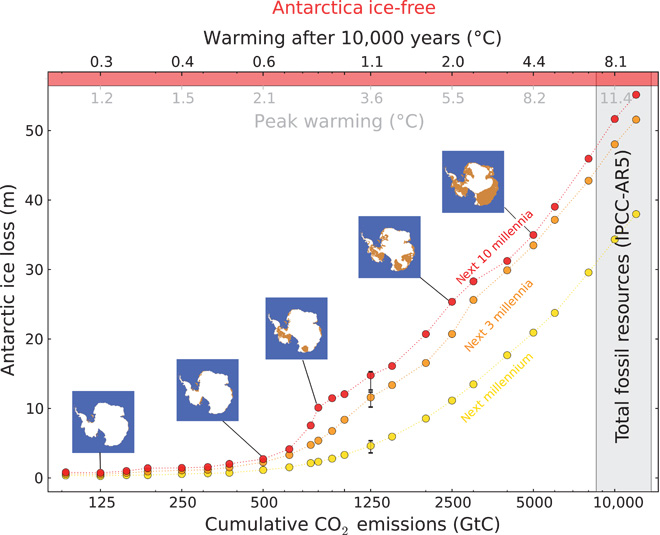
Figure 2 from Winkelmann et al. (2015) indicating how much Antarctic ice loss is projected to occur as a result of different amounts of cumulative carbon dioxide emission, over the next one, three and ten millennia. Note that 10,000 GtC of cumulative emissions results in about 60 m (about 200 ft) of sea-level rise over the long term (taking additional contributions from Greenland and mountain glaciers into account).

According to the USGS, there 24,064,000 km3 of ice and snow in the world.

According to Winkelmann et al. (2015), it would take about 10,000 GtC to melt (nearly) all of this ice.

If we divide 24,064,000 km3  by 10,000 GtC, assume the density of the ice is 1 kg per liter, and do the appropriate unit conversions, we can conclude that each kg of carbon emitted as CO2 will ultimately melt about 2,400 kg of ice.  This is a huge number.

Another way of expressing this is that each pound of carbon released to the atmosphere as CO2 is likely to end up melting more than a ton of glacial ice.

Often, people like to think in units of tons or kg of CO2 instead of tons or kg of carbon. In these units, each kg of CO2 ultimately melts about 650 kg of glacial ice.


Each American emits on average about 16 tons of CO2 to the atmosphere each year, primarily from the burning of coal, oil and gas, and atmospheric release of the resulting waste CO2.

This works out to about 1.8 kg (about 4 pounds) of CO2 per hour per American. This is more than twice the per capita emission rate of Europe and about twenty times the per capita emission rate for sub-Saharan Africa.

If I am an average American, the CO2 emissions that I produce each year (by participating in the broader economy) will be responsible for melting about 10,000 tons of Antarctic ice, adding about 10,000 cubic meters of fresh water to the volume of the oceans.

That works out to about more than a ton of Antarctic ice loss for each hour of CO2 emissions from an average American. Every minute, we emit enough CO2 to add another five gallons of water to the oceans through glacial ice melt.

If you do the units conversion, this means that each American on average emits enough CO2 every 3 seconds to ultimately add about another liter of water to the oceans. The Europeans emit enough CO2 to add another liter to sea-level rise every 8 seconds, and the sub-Saharan Africans add a liter of seawater’s worth of CO2 emissions every minute.

In my freezer, there is an ice cube tray with 16 smallish ice cubes. The ice cubes in this tray all together had a mass of 345 g, or about 1/3 of a kg. That means that I am responsible for, every second, emitting enough CO2 to melt about an ice-cube-tray’s worth of Antarctica.


Economists often like to think in terms of “carbon-intensity of our economy” meaning how much CO2 to we emit per dollar of value produced or consumed.  We can also think about the “ice-intensity of our economy”: How much ice is melted per dollar of value produced or consumed?

In the United States, per capita GDP is a little less than $60,000 per year.  If our CO2 emissions per capita will ultimately melt about 10,000 tons of ice, that means that, on average, for every $6 we spend in our economy, we are melting another ton of ice.

In the European Union, per capita GDP is a little over $32,000 per year. If you do the math, this works out to a ton of ice of ice ultimately melted for every $8 (7 euros) spent in their economy.

Sub-Saharan Africa has a per capita GDP a little over $1400 per year. Their per capita GDP is about 1/40th of per capita GDP in the US, but their per capita emissions are about 1/20th of ours. This means that on average, for every $3 spent in Sub-Saharan Africa, about one ton of ice will ultimately be melted.


Admittedly, by the time scales of our ordinary activities, ice sheets take a long time to melt. The melting caused by a CO2 emission today will extend out over thousands of years.

There are complex moral questions related to balance short-term and long-term interests. Not everyone thinks we should be taking the long-term melting of Antarctica into account.

However, if the ancient Romans had undergone an industrial revolution similar to ours and fueled a century or two of economic development using fossil-fuels with disposal of the waste CO2 in the atmosphere, sea level today would be rising about 3 cm each year (more than an inch a year) due to the long-term effects of their emissions on the great ice sheets.

If their scientists had told them of the long-term consequences, but they had nevertheless decided to neglect those consequences so that they could be a few percent richer in the short term, I imagine that we would take a fairly dim view of their moral standing.


Post updated 26 March 2018.

swatch-white_8


Looking for postdocs wanting to help facilitate a transition to a near-zero emission energy system

This is from an email sent today to colleagues in my department:

Folks,

Postdocs in my lab either have gotten or may be about to get more permanent employment, which puts me in the position of constantly trying to recruit great people.

If you know people who are really good and who are going to get their PhD degrees within a year or two (or have gotten their degree within the past year or two), please forward this email to them.

I really don’t care about people’s domain knowledge. I look to see that they are smart, productive, creative, able to complete projects, can write, can speak, can do math, etc.  Smart people can learn the relevant facts quickly.

We are a good place for people who want to understand the big picture, and who will not get lost investigating interesting but ultimately unimportant detail.

Ability to demonstrate an interest in the challenges associated with a clean energy system transition is important, but experience addressing these challenges is not important.

Two postdocs in my group engaged in geophysical modeling may move on this year, so there is space for at least two people who want to understand limits on and opportunities for clean energy systems from a geophysical perspective.

I am trying to build up our idealized energy-system-modeling effort, so there is room to hire a few people there. There is also room for people who want to do idealized economic analysis related to development and decarbonization.

On a different topic, we have had two Nature papers now which represent the culmination of our ocean acidification-related work on coral reefs in Australia (Albright et al, 2016, 2018). While I am not actively recruiting in this area, if there was a postdoc candidate who has a great idea on how to carry this work forward, and who would want to lead the project, I can make room for such a person.

In short, I would appreciate it if you would use your networks to help me find good people who are interested in topics that my group is interested in. We are open to hiring non-traditional candidates who have interest, but lack experience, in these topic areas.

The job postings can be reached through this link: http://carnegieenergyinnovation.org/index.php/jobs/

Best,
Ken

shaner-fig1a
swatch-white_8

Geophysical constraints on the reliability of solar and wind power in the United States

We recently published a paper that does a very simple analysis of meeting electricity demand using solar and wind generation only, in addition to some form of energy storage. We looked at the relationships between fraction of electricity demand satisfied and the amounts of wind, solar, and electricity storage capacity deployed.

M.R. Shaner, S.J. Davis, N.S. Lewis and K. Caldeira. Geophysical constraints on the reliability of solar and wind power in the United States. Energy & Environmental Science, DOI: 10.1039/C7EE03029K (2018).  (Please email for a copy if you can’t get through the paywall.)

Our main conclusion is that geophysically-forced variability in wind and solar generation means that the amount of electricity demand satisfied using wind and solar resources is fairly linear up to about 80% of annually averaged electricity demand, but that beyond this level of penetration the amount of added wind and solar generation capacity or the amount of electricity storage needed would rise sharply.

Obviously, people have addressed this problem with more complete models. Notable examples are the NREL Renewable Electricity Futures Study and another is the NOAA study (McDonald, Clack et al., 2016). These studies have concluded that it would be possible to eliminate about 80% of emissions from the U.S. electric sector using grid-inter-connected wind and solar power. In contrast, other studies (e.g., Jacobson et al, 2015) have concluded that far deeper penetration of intermittent renewables was feasible.

What is the purpose of writing a paper that uses a toy model to analyze a highly simplified system?

shaner-fig1a

Fig 1b. from Shaner et al. (E&ES, 2018) illustrating variability in wind and solar resources, averaged over the entire contiguous United States based on 36 years of weather data. Also shown is electricity demand for a single year.

The purpose of our paper is to look at fundamental constraints that geophysics places on delivery of energy from intermittent renewable sources.  For some specified amount of demand and specified amount of wind and solar capacity, the gap between energy generation and electricity demand can be calculated. This gap would need to be made up by some combination of (1) other forms of dispatchable power such as natural gas, (2) electricity storage, for example as in batteries or pumped hydro storage, or (3) reducing electricity loads or shifting them in time. This simple geophysically-based calculation makes it clear how big a gap would need to be filled.

Our simulations corresponds to the situation in which their is an ideal and perfect continental scale electricity grid, so we are assuming perfect electricity transmission. We also assume that batteries are 100% efficient. We are considering a spherical cow.

Part of the issue with the more complicated studies is that the models are black boxes, and one has to essentially trust the authors that everything is OK inside of that black box, and that all assumptions have been adequately explained. [Note that Clack et al. (2015) do describe the model and assumptions used in McDonald, Clack et al. (2016) in detail, and that the NREL study also contains substantial methodological detail.]

In contrast, because we are using a toy model, we can include the entire source code for our toy model in the Supplemental Information to our paper. And all of our input data is from publicly available sources. So you don’t have to trust us. You can look at our code and see what we did. If you don’t like our assumptions, modify the assumptions in our code and explore for yourself. (If you want the time series data that we used, please feel free to request them from me.)

Our key results are summarized in our Fig. 3:

Shaner-Fig3

Figure 3 | Changes in the amount of demand met as a function of energy storage capacity (0-32 days) and generation.

The two columns of Fig. 3 show the same data: the left column is on linear scales; the right column has a log scale on the horizontal axis. [In a wind/solar/storage-only system, meeting 99.9% of demand is equivalent to about 8.76 hours of blackout per year, and 99.99% is equivalent to about 53 minutes of blackout per year.]

The left column of Fig. 3 shows, for various mixes of wind and solar, that the fraction of electricity demand that is met by introducing intermittent renewables at first goes up linearly — if you increase the amount of solar and/or wind power by 10%, the amount of generation goes up by about 10%, and is relatively insensitive to assumptions about electricity storage.

From the right column of Fig. 3, it can be seen that that as the fraction of electricity demand satisfied by solar and/or wind exceeds about 80%, then the the amount of generation  and/or the amount of electricity storage required increases sharply. It should be noted that even in the cases in which 80% of electricity is supplied by intermittent renewables on the annual average, there are still times when wind and solar is providing very little power, and if blackouts are to be avoided, the gap-filling dispatchable electricity service must be sized nearly as large as the entire electricity system.

This ‘consider a spherical cow’ approach shows that satisfying nearly all electricity demand with wind and solar (and electricity storage) will be extremely difficult given the variability and intermittency in wind and solar resources.

On the other hand, if we could get enough energy storage (or its equivalent in load shifting) to satisfy several weeks of total U.S. electricity demand, then mixes of wind and solar might do a great job of meeting all U.S. electricity demand. [Look at the dark green lines in the three middle panels in the right column of Fig. 3.] This is more-or-less the solution that  Jacobson et al. (2015) got for the electric sector in that work.

Our study, using very simple models and a very transparent approach, is broadly consistent the findings of  the NREL, NOAA, and  Jacobson et al. (2015) studies, which were done using much more comprehensive, but less transparent, models. Our results also suggest that a main difference in conclusions between the NREL and NOAA studies and the Jacobson et al. (2015) study is that Jacobson et al. (2015) assume the availability of large amounts of energy storage, and that this is a primary factor differentiating these works. (The NOAA study showed that one could reduce emissions from the electric sector by 80% with wind and solar and without storage if sufficient back-up power was available from natural gas or some other dispatchable electricity generator.)

All of these studies share common ground. They all indicate that lots more wind and solar power could be deployed today and this would reduce greenhouse gas emissions. Controversies about how to handle the end game should not overly influence our opening moves.

There are still questions regarding whether future near-zero emission energy systems will be based on centralized dispatchable (e.g., nuclear and fossil with CCS) or distributed intermittent (e.g., wind and solar) electricity generation. Nevertheless, the climate problem is serious enough that for now we might want to consider an ‘all of the above’ strategy, and deploy as fast as we can the most economically efficient and environmentally acceptable energy generation technologies that are available today.

swatch-white_8